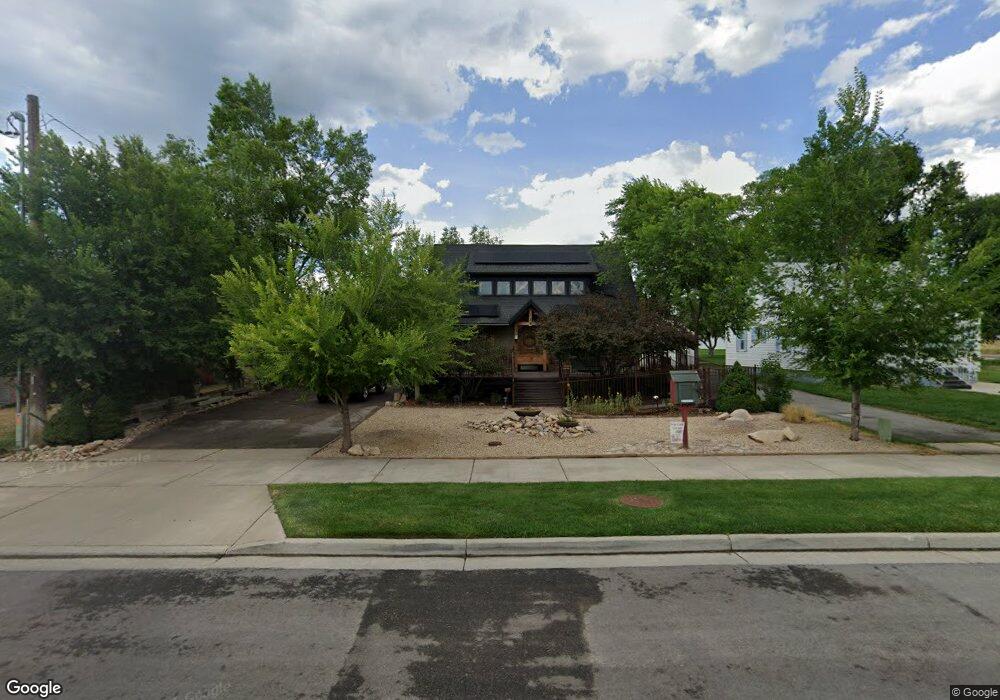
159 E Main St Midway, UT 84049
Estimated Value: $958,000 - $2,095,000
2
Beds
3
Baths
2,284
Sq Ft
$564/Sq Ft
Est. Value
About This Home
This home is located at 159 E Main St, Midway, UT 84049 and is currently estimated at $1,288,586, approximately $564 per square foot. 159 E Main St is a home located in Wasatch County with nearby schools including Midway Elementary School, Rocky Mountain Middle School, and Wasatch High School.
Ownership History
Date
Name
Owned For
Owner Type
Purchase Details
Closed on
Nov 20, 2024
Sold by
Wassum Llc and Griffin Judith Judd
Bought by
Judith Judd Griffin Legacy Trust and Griffin
Current Estimated Value
Purchase Details
Closed on
May 11, 2009
Sold by
Cdm Property Management Llc
Bought by
Wassum Llc
Home Financials for this Owner
Home Financials are based on the most recent Mortgage that was taken out on this home.
Original Mortgage
$325,000
Interest Rate
4.8%
Mortgage Type
Seller Take Back
Purchase Details
Closed on
Apr 20, 2009
Sold by
Johnson Kent R
Bought by
Cdm Property Management Llc
Home Financials for this Owner
Home Financials are based on the most recent Mortgage that was taken out on this home.
Original Mortgage
$325,000
Interest Rate
4.8%
Mortgage Type
Seller Take Back
Purchase Details
Closed on
Sep 11, 2008
Sold by
Martinsen Charles Daniel
Bought by
Cdm Property Management Llc
Create a Home Valuation Report for This Property
The Home Valuation Report is an in-depth analysis detailing your home's value as well as a comparison with similar homes in the area
Home Values in the Area
Average Home Value in this Area
Purchase History
| Date | Buyer | Sale Price | Title Company |
|---|---|---|---|
| Judith Judd Griffin Legacy Trust | -- | None Listed On Document | |
| Wassum Llc | -- | Backman Title Services Ltd | |
| Cdm Property Management Llc | -- | None Available | |
| Cdm Property Management Llc | -- | Accommodation |
Source: Public Records
Mortgage History
| Date | Status | Borrower | Loan Amount |
|---|---|---|---|
| Previous Owner | Wassum Llc | $325,000 |
Source: Public Records
Tax History
| Year | Tax Paid | Tax Assessment Tax Assessment Total Assessment is a certain percentage of the fair market value that is determined by local assessors to be the total taxable value of land and additions on the property. | Land | Improvement |
|---|---|---|---|---|
| 2025 | $4,314 | $851,140 | $300,000 | $551,140 |
| 2024 | $4,266 | $851,140 | $300,000 | $551,140 |
| 2023 | $4,266 | $887,825 | $200,000 | $687,825 |
| 2022 | $4,896 | $887,825 | $200,000 | $687,825 |
| 2021 | $3,129 | $438,399 | $150,000 | $288,399 |
| 2020 | $2,368 | $321,804 | $163,560 | $158,244 |
| 2019 | $2,746 | $224,394 | $0 | $0 |
| 2018 | $2,746 | $224,394 | $0 | $0 |
| 2017 | $2,482 | $201,630 | $0 | $0 |
| 2016 | $2,545 | $201,630 | $0 | $0 |
| 2015 | $2,418 | $201,630 | $0 | $0 |
| 2014 | $3,074 | $246,268 | $119,000 | $127,268 |
Source: Public Records
Map
Nearby Homes
Your Personal Tour Guide
Ask me questions while you tour the home.