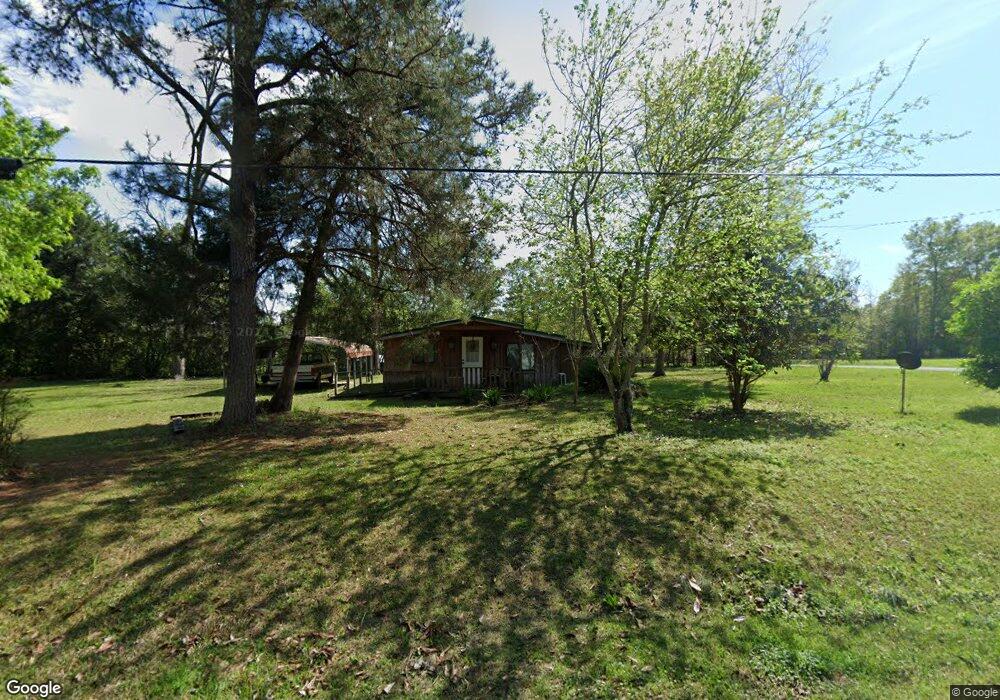
159 Harrell Ave NE Whigham, GA 39897
Estimated Value: $50,000 - $82,401
2
Beds
--
Bath
600
Sq Ft
$113/Sq Ft
Est. Value
About This Home
This home is located at 159 Harrell Ave NE, Whigham, GA 39897 and is currently estimated at $67,850, approximately $113 per square foot. 159 Harrell Ave NE is a home located in Grady County.
Ownership History
Date
Name
Owned For
Owner Type
Purchase Details
Closed on
Sep 3, 2020
Sold by
Nola Janey
Bought by
Sellers James H and Sellers Lisa J
Current Estimated Value
Purchase Details
Closed on
Mar 9, 2016
Sold by
Harrell William Cuy
Bought by
Harrell Sheridan Sasser
Purchase Details
Closed on
Dec 30, 1986
Sold by
Harris Danny and Harris Jean E
Bought by
Harris Danny
Create a Home Valuation Report for This Property
The Home Valuation Report is an in-depth analysis detailing your home's value as well as a comparison with similar homes in the area
Home Values in the Area
Average Home Value in this Area
Purchase History
| Date | Buyer | Sale Price | Title Company |
|---|---|---|---|
| Sellers James H | $33,000 | -- | |
| Harrell Sheridan Sasser | -- | -- | |
| Harris Danny | $800 | -- |
Source: Public Records
Tax History Compared to Growth
Tax History
| Year | Tax Paid | Tax Assessment Tax Assessment Total Assessment is a certain percentage of the fair market value that is determined by local assessors to be the total taxable value of land and additions on the property. | Land | Improvement |
|---|---|---|---|---|
| 2024 | $814 | $22,293 | $4,160 | $18,133 |
| 2023 | $488 | $13,353 | $3,655 | $9,698 |
| 2022 | $488 | $13,353 | $3,655 | $9,698 |
| 2021 | $484 | $13,353 | $3,655 | $9,698 |
| 2020 | $164 | $4,455 | $3,655 | $800 |
| 2019 | $164 | $4,455 | $3,655 | $800 |
| 2018 | $155 | $4,455 | $3,655 | $800 |
| 2017 | $149 | $4,455 | $3,655 | $800 |
| 2016 | $152 | $4,455 | $3,655 | $800 |
| 2015 | $150 | $4,455 | $3,655 | $800 |
| 2014 | $150 | $4,455 | $3,655 | $800 |
| 2013 | -- | $4,455 | $3,655 | $800 |
Source: Public Records
Map
Nearby Homes
- 206 Lodge Ln
- 165 Larkin St
- 267 Providence Rd
- 723 Providence Rd
- 1718 Old 179 S
- 231 Mcintyre Ln
- 2033 Old 179 N
- 0 Upper Hawthorne Trail
- 1520 Upper Hawthorne Trail
- 1137 Summerfield
- 1389 Lake Front Dr
- Lot 1 Crine Blvd
- 1500 15th Ave NW
- 1296 McQuaig St NW
- 0 Earl Hester Rd
- 490 13th St SW
- 1200 15th Ave NW
- 000 1st Ave SW
- 00 Tired Creek Rd
- 1741 Georgia 112
- 160 Harrell Ave NE
- 144 Harrell Ave NE
- 152 Christopher Ave NE
- 175 Harrell Ave NE
- 136 Christopher Ave NE
- 210 Jordan St NE
- 224 Collins St
- 155 Christopher Ave NE
- 169 Christopher Ave NE
- 214 Collins St
- 193 Harrell Ave NE
- 104 Harrell Ave NE
- 109 Christopher Ave NE
- 211 N McGriff St
- 261 N McGriff St
- 251 N McGriff St
- 199 N McGriff St
- 120 Davis Ave
- 116 Harrell Ave NW
- 275 N McGriff St