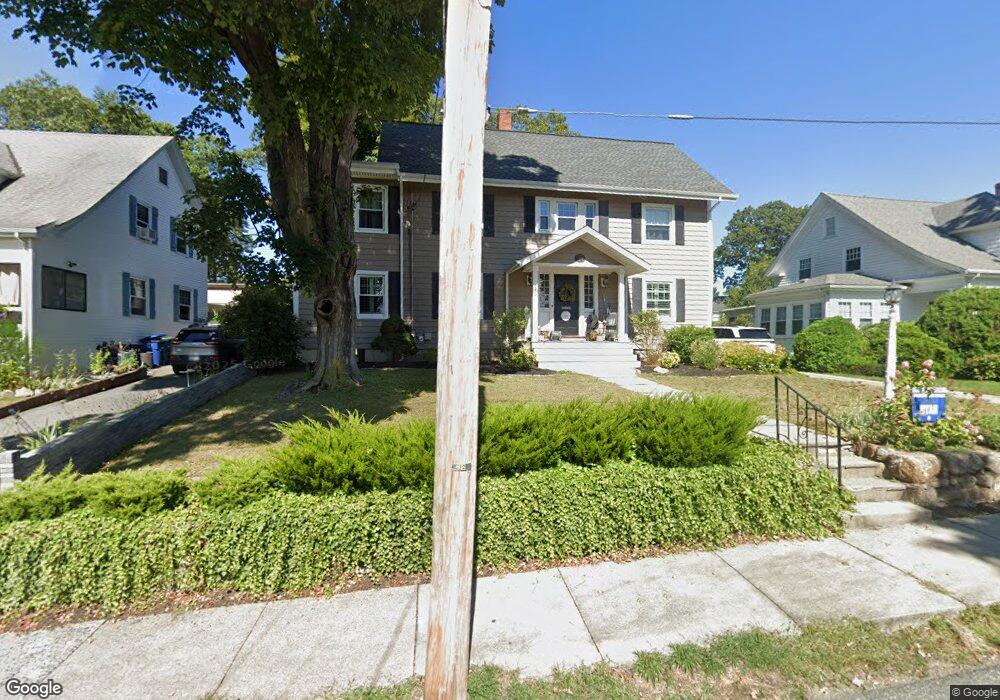
159 Hobart Ave Braintree, MA 02184
North Braintree NeighborhoodEstimated Value: $1,222,000 - $1,334,000
4
Beds
3
Baths
3,036
Sq Ft
$417/Sq Ft
Est. Value
About This Home
This home is located at 159 Hobart Ave, Braintree, MA 02184 and is currently estimated at $1,267,000, approximately $417 per square foot. 159 Hobart Ave is a home located in Norfolk County with nearby schools including Braintree High School, Step Ahead Kindergarten, and Meeting House Montessori School.
Ownership History
Date
Name
Owned For
Owner Type
Purchase Details
Closed on
Mar 11, 2025
Sold by
Ryan Walter J and Ryan Kristine M
Bought by
Ryan Ft and Ryan
Current Estimated Value
Purchase Details
Closed on
Jun 24, 2009
Sold by
Wells Fargo Bk
Bought by
Us Bk and Ryan Kristine M
Home Financials for this Owner
Home Financials are based on the most recent Mortgage that was taken out on this home.
Original Mortgage
$343,000
Interest Rate
4.92%
Mortgage Type
Purchase Money Mortgage
Purchase Details
Closed on
May 2, 2008
Sold by
Robbie Coleen O and Wells Fargo Bk
Bought by
Wells Fargo Bk
Create a Home Valuation Report for This Property
The Home Valuation Report is an in-depth analysis detailing your home's value as well as a comparison with similar homes in the area
Home Values in the Area
Average Home Value in this Area
Purchase History
| Date | Buyer | Sale Price | Title Company |
|---|---|---|---|
| Ryan Ft | -- | None Available | |
| Ryan Ft | -- | None Available | |
| Us Bk | -- | -- | |
| Ryan Walter J | $490,000 | -- | |
| Us Bk | -- | -- | |
| Wells Fargo Bk | $493,514 | -- | |
| Wells Fargo Bk | $493,514 | -- |
Source: Public Records
Mortgage History
| Date | Status | Borrower | Loan Amount |
|---|---|---|---|
| Previous Owner | Wells Fargo Bk | $336,900 | |
| Previous Owner | Ryan Walter J | $343,000 | |
| Previous Owner | Wells Fargo Bk | $0 |
Source: Public Records
Tax History
| Year | Tax Paid | Tax Assessment Tax Assessment Total Assessment is a certain percentage of the fair market value that is determined by local assessors to be the total taxable value of land and additions on the property. | Land | Improvement |
|---|---|---|---|---|
| 2025 | $10,365 | $1,038,600 | $386,000 | $652,600 |
| 2024 | $9,219 | $972,500 | $344,600 | $627,900 |
| 2023 | $8,848 | $906,600 | $312,500 | $594,100 |
| 2022 | $8,257 | $829,800 | $275,700 | $554,100 |
| 2021 | $7,943 | $798,300 | $275,700 | $522,600 |
| 2020 | $7,545 | $765,200 | $242,600 | $522,600 |
| 2019 | $7,139 | $707,500 | $242,600 | $464,900 |
| 2018 | $7,026 | $666,600 | $220,600 | $446,000 |
| 2017 | $6,957 | $647,800 | $220,600 | $427,200 |
| 2016 | $6,593 | $600,500 | $198,500 | $402,000 |
| 2015 | $6,474 | $584,800 | $198,500 | $386,300 |
| 2014 | $5,967 | $522,500 | $164,500 | $358,000 |
Source: Public Records
Map
Nearby Homes
- 5 Woodsum Dr Unit 12
- 18 Royal Lake Dr Unit 3
- 6 Franklin St
- 491 Washington St Unit 1
- 87 Walnut St
- 469-471 Washington St
- 7 Del's Way
- 15 Calvin St
- 145 Hancock St Unit 307
- 145 Hancock St Unit 201
- 29 Saint Michael Rd
- 47 Addison St
- 63 Dickerman Ln
- 44 Shepard Rd
- 50 Cleveland Ave
- 36 Chestnut Ave
- 29 Joseph Rd
- 418 John Mahar Hwy Unit 408
- 20 Vine St
- 20 Blossom Rd
- 163 Hobart Ave
- 155 Hobart Ave
- 167 Hobart Ave
- 146 Academy St
- 151 Hobart Ave
- 150 Academy St
- 240 Tremont St
- 242 Tremont St
- 160 Hobart Ave
- 156 Academy St
- 177 Hobart Ave
- 148 Hobart Ave
- 230 Tremont St
- 174 Hobart Ave
- 134 Hollingsworth Ave
- 23 Elmwood Ave
- 256 Tremont St
- 166 Academy St
- 126 Hollingsworth Ave
- 239 Tremont St
Your Personal Tour Guide
Ask me questions while you tour the home.