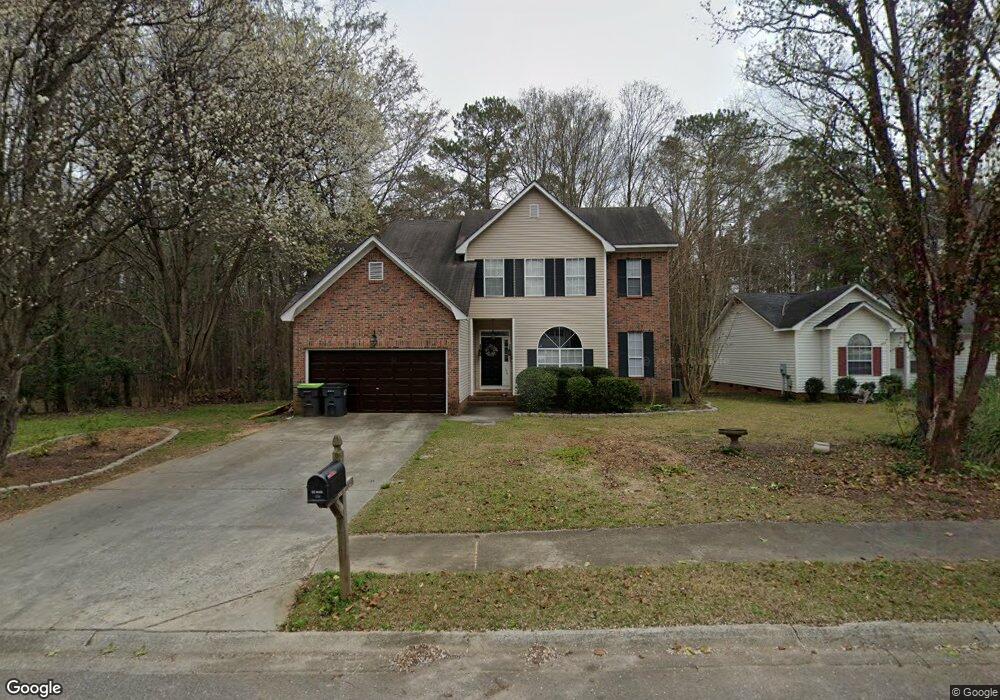
159 Hunters Trail Lexington, SC 29072
Estimated Value: $259,000 - $309,000
4
Beds
3
Baths
1,890
Sq Ft
$152/Sq Ft
Est. Value
About This Home
This home is located at 159 Hunters Trail, Lexington, SC 29072 and is currently estimated at $288,140, approximately $152 per square foot. 159 Hunters Trail is a home located in Lexington County with nearby schools including Midway Elementary School, River Bluff High School, and American Leadership Academy South Carolina-Lexington Campus.
Ownership History
Date
Name
Owned For
Owner Type
Purchase Details
Closed on
Sep 12, 2019
Sold by
Fisher Sydney
Bought by
Fisher John Daniel
Current Estimated Value
Purchase Details
Closed on
Jan 26, 2018
Sold by
Syss Llc
Bought by
Fisher John Daniel and Fisher Sydney
Home Financials for this Owner
Home Financials are based on the most recent Mortgage that was taken out on this home.
Original Mortgage
$162,475
Outstanding Balance
$137,394
Interest Rate
3.93%
Mortgage Type
New Conventional
Estimated Equity
$150,746
Purchase Details
Closed on
Mar 1, 2017
Sold by
Fifth Third Bank An Ohio Banking Corpora
Bought by
Syss Llc
Home Financials for this Owner
Home Financials are based on the most recent Mortgage that was taken out on this home.
Original Mortgage
$200,000
Interest Rate
4.15%
Mortgage Type
New Conventional
Purchase Details
Closed on
Apr 15, 2016
Sold by
Fifth Third Home Equity
Bought by
Fifth Third Bank
Create a Home Valuation Report for This Property
The Home Valuation Report is an in-depth analysis detailing your home's value as well as a comparison with similar homes in the area
Home Values in the Area
Average Home Value in this Area
Purchase History
| Date | Buyer | Sale Price | Title Company |
|---|---|---|---|
| Fisher John Daniel | -- | None Available | |
| Fisher John Daniel | $167,500 | None Available | |
| Syss Llc | $100,000 | None Available | |
| Fifth Third Bank | $166,500 | None Available |
Source: Public Records
Mortgage History
| Date | Status | Borrower | Loan Amount |
|---|---|---|---|
| Open | Fisher John Daniel | $162,475 | |
| Previous Owner | Syss Llc | $200,000 |
Source: Public Records
Tax History Compared to Growth
Tax History
| Year | Tax Paid | Tax Assessment Tax Assessment Total Assessment is a certain percentage of the fair market value that is determined by local assessors to be the total taxable value of land and additions on the property. | Land | Improvement |
|---|---|---|---|---|
| 2024 | $1,179 | $6,715 | $1,400 | $5,315 |
| 2023 | $1,179 | $6,715 | $1,400 | $5,315 |
| 2022 | $1,176 | $6,715 | $1,400 | $5,315 |
| 2020 | $5,092 | $10,072 | $2,100 | $7,972 |
| 2019 | $1,271 | $6,700 | $1,200 | $5,500 |
| 2018 | $4,640 | $8,811 | $1,800 | $7,011 |
| 2017 | $4,567 | $8,811 | $1,800 | $7,011 |
| 2016 | $4,435 | $8,810 | $1,800 | $7,010 |
| 2014 | $1,428 | $8,138 | $1,620 | $6,518 |
| 2013 | -- | $8,140 | $1,620 | $6,520 |
Source: Public Records
Map
Nearby Homes
- 156 Hunters Trail
- 108 Hunters Ridge Dr
- 145 Cherokee Pond Ct
- 113 Cherokee Pond Ct
- 2440 Thode Ln
- 1442 Trailhead Ln
- 1453 Trailhead Ln
- 481 Forest Edge Trail
- 1423 Trailhead Ln
- 441 Forest Edge Trail
- 488 Forest Edge Trail
- 476 Forest Edge Trail
- 433 Forest Edge Trail
- 425 Forest Edge Trail
- 417 Forest Edge Trail
- EATON Plan at Cross Creek
- LITCHFIELD Plan at Cross Creek
- BRADFORD Plan at Cross Creek
- DARBY Plan at Cross Creek
- 561 Plymouth Pass Dr
- 163 Hunters Trail
- 151 Hunters Trail
- 167 Hunters Trail
- 160 Hunters Trail
- 164 Hunters Trail
- 171 Hunters Trail
- 168 Hunters Trail
- 152 Hunters Trail
- 143 Hunters Trail
- 172 Hunters Trail
- 175 Hunters Trail
- 148 Hunters Trail
- 112 Cottage Green Ln
- 116 Cottage Green Ln
- 108 Cottage Green Ln
- 176 Hunters Trail
- 118 Cottage Green Ln
- 104 Cottage Green Ln
- 144 Hunters Trail
- 104 Stirrup Ln