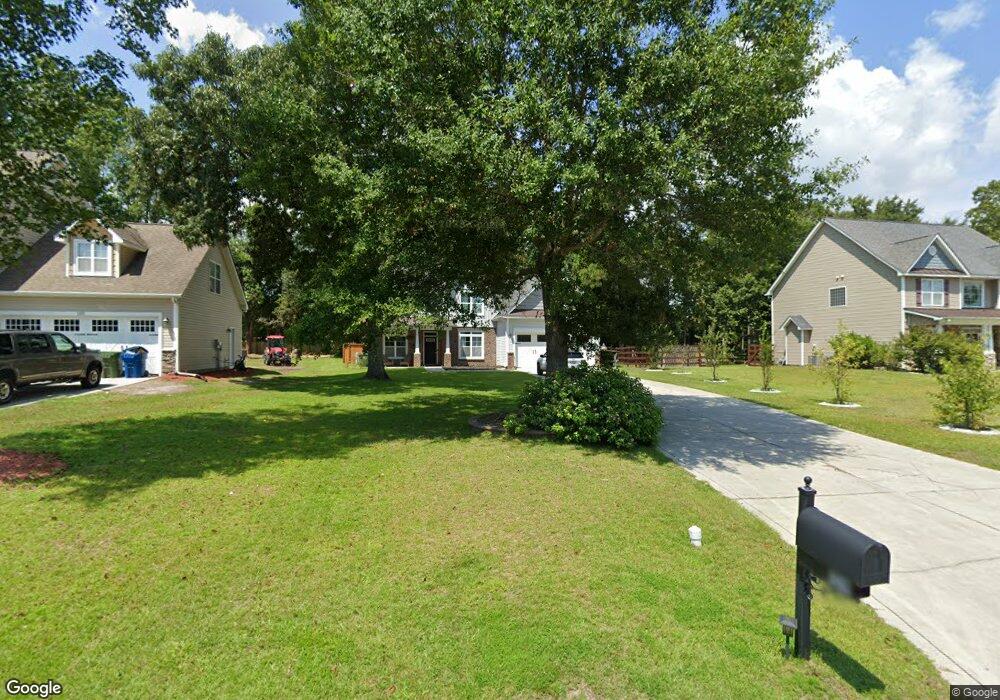
159 Old Millstone Landing Sneads Ferry, NC 28460
Estimated Value: $474,000 - $510,987
4
Beds
4
Baths
3,152
Sq Ft
$156/Sq Ft
Est. Value
About This Home
This home is located at 159 Old Millstone Landing, Sneads Ferry, NC 28460 and is currently estimated at $491,997, approximately $156 per square foot. 159 Old Millstone Landing is a home located in Onslow County with nearby schools including Dixon Elementary School, Dixon High School, and Born Again Christian Academy.
Ownership History
Date
Name
Owned For
Owner Type
Purchase Details
Closed on
Jul 28, 2022
Sold by
Marshall Jordan B and Marshall Jennifer M
Bought by
Roulette Bryan E and Roulette Samantha J
Current Estimated Value
Home Financials for this Owner
Home Financials are based on the most recent Mortgage that was taken out on this home.
Original Mortgage
$399,500
Outstanding Balance
$381,296
Interest Rate
5.3%
Mortgage Type
New Conventional
Estimated Equity
$110,701
Purchase Details
Closed on
May 9, 2017
Sold by
Truman Spencer C and Truman Jenny R
Bought by
Marshall Jordan B and Marshall Jennifer M
Home Financials for this Owner
Home Financials are based on the most recent Mortgage that was taken out on this home.
Original Mortgage
$264,100
Interest Rate
4.03%
Mortgage Type
VA
Purchase Details
Closed on
May 19, 2010
Sold by
H & H Constructors Inc
Bought by
Truman Spencer C and Truman Jenny R
Home Financials for this Owner
Home Financials are based on the most recent Mortgage that was taken out on this home.
Original Mortgage
$278,910
Interest Rate
5.03%
Mortgage Type
VA
Create a Home Valuation Report for This Property
The Home Valuation Report is an in-depth analysis detailing your home's value as well as a comparison with similar homes in the area
Home Values in the Area
Average Home Value in this Area
Purchase History
| Date | Buyer | Sale Price | Title Company |
|---|---|---|---|
| Roulette Bryan E | $425,000 | Collins Robert G | |
| Marshall Jordan B | $264,500 | None Available | |
| Truman Spencer C | $270,000 | None Available |
Source: Public Records
Mortgage History
| Date | Status | Borrower | Loan Amount |
|---|---|---|---|
| Open | Roulette Bryan E | $399,500 | |
| Previous Owner | Marshall Jordan B | $264,100 | |
| Previous Owner | Truman Spencer C | $278,910 |
Source: Public Records
Tax History Compared to Growth
Tax History
| Year | Tax Paid | Tax Assessment Tax Assessment Total Assessment is a certain percentage of the fair market value that is determined by local assessors to be the total taxable value of land and additions on the property. | Land | Improvement |
|---|---|---|---|---|
| 2025 | $2,252 | $343,892 | $55,900 | $287,992 |
| 2024 | $2,252 | $343,892 | $55,900 | $287,992 |
| 2023 | $2,252 | $343,892 | $55,900 | $287,992 |
| 2022 | $2,252 | $343,892 | $55,900 | $287,992 |
| 2021 | $1,962 | $278,300 | $47,900 | $230,400 |
| 2020 | $1,962 | $278,300 | $47,900 | $230,400 |
| 2019 | $1,962 | $278,300 | $47,900 | $230,400 |
| 2018 | $1,962 | $278,300 | $47,900 | $230,400 |
| 2017 | $2,014 | $298,330 | $82,080 | $216,250 |
| 2016 | $2,014 | $298,330 | $0 | $0 |
| 2015 | $2,014 | $298,330 | $0 | $0 |
| 2014 | $2,014 | $298,330 | $0 | $0 |
Source: Public Records
Map
Nearby Homes
- 163 Old Millstone Landing Ln
- 136 Old Millstone Landing Ln
- 300 Sea Urchin Cove
- 622 High Tide Dr
- 614 High Tide Dr
- 427 Sunfish Ln
- 1123 Mill Run Rd
- 113 Windy Point
- 108 Rollingwood Cir
- 104 Rollingwood Cir
- 116 Regatta Way
- 901 Nubble Ct
- 342 W Goldeneye Ln
- 1008 Mill Run Rd
- 362 W Goldeneye Ln
- 262 Cuddy Ct
- 402 Canvasback Ln
- 505 W Red Head Cir
- 326 Starfish Ln
- 303 Starfish Ln
- 159 Old Millstone Landing Ln
- 155 Old Millstone Landing Ln
- 155 Old Millstone Landing
- 163 Old Millstone Landing
- 163 Old Millstone Landing
- 151 Old Millstone Landing
- 151 Old Millstone Landing Ln
- 152 Old Millstone Landing
- 152 Old Millstone Landing
- 147 Old Millstone Landing
- 147 Old Millstone Landing Ln
- 140 Old Millstone Landing Ln
- 140 Old Millstone Landing
- 143 Old Millstone Landing Ln
- 167 Old Millstone Landing Ln
- 143 Old Millstone Landing
- 167 Old Millstone Landing
- 148 Old Millstone Landing Ln
- 148 Old Millstone Landing
- 168 Old Millstone Landing