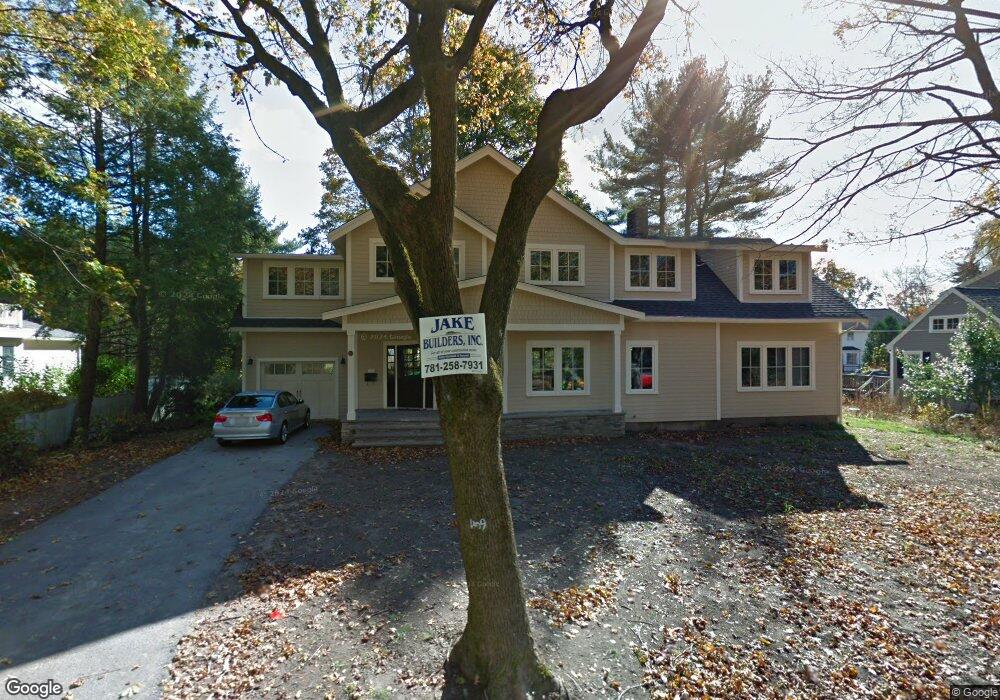
159 Summer St Andover, MA 01810
East Andover NeighborhoodEstimated Value: $1,037,000 - $1,345,000
2
Beds
1
Bath
1,324
Sq Ft
$925/Sq Ft
Est. Value
About This Home
This home is located at 159 Summer St, Andover, MA 01810 and is currently estimated at $1,224,083, approximately $924 per square foot. 159 Summer St is a home located in Essex County with nearby schools including Bancroft Elementary School, Doherty Middle School, and Andover High School.
Ownership History
Date
Name
Owned For
Owner Type
Purchase Details
Closed on
Jul 19, 2011
Sold by
Arcidy Josephine M Est and Arcidy
Bought by
Hare John P and Quinn Joy M
Current Estimated Value
Home Financials for this Owner
Home Financials are based on the most recent Mortgage that was taken out on this home.
Original Mortgage
$280,000
Interest Rate
4.58%
Mortgage Type
Purchase Money Mortgage
Purchase Details
Closed on
Dec 29, 2010
Sold by
Arcidy Josephine M Est and Arcidy
Bought by
Arcidy Samuel S and Arcidy Mary H
Create a Home Valuation Report for This Property
The Home Valuation Report is an in-depth analysis detailing your home's value as well as a comparison with similar homes in the area
Home Values in the Area
Average Home Value in this Area
Purchase History
| Date | Buyer | Sale Price | Title Company |
|---|---|---|---|
| Hare John P | $350,000 | -- | |
| Hare John P | $350,000 | -- | |
| Arcidy Samuel S | -- | -- | |
| Arcidy Samuel S | -- | -- |
Source: Public Records
Mortgage History
| Date | Status | Borrower | Loan Amount |
|---|---|---|---|
| Open | Arcidy Samuel S | $250,000 | |
| Closed | Hare John P | $280,000 |
Source: Public Records
Tax History
| Year | Tax Paid | Tax Assessment Tax Assessment Total Assessment is a certain percentage of the fair market value that is determined by local assessors to be the total taxable value of land and additions on the property. | Land | Improvement |
|---|---|---|---|---|
| 2024 | $14,505 | $1,126,200 | $475,600 | $650,600 |
| 2023 | $13,914 | $1,018,600 | $428,400 | $590,200 |
| 2022 | $13,429 | $919,800 | $379,100 | $540,700 |
| 2021 | $12,900 | $843,700 | $344,600 | $499,100 |
| 2020 | $12,422 | $827,600 | $336,300 | $491,300 |
| 2019 | $12,004 | $786,100 | $323,200 | $462,900 |
| 2018 | $11,461 | $732,800 | $304,800 | $428,000 |
| 2017 | $11,009 | $725,200 | $298,700 | $426,500 |
| 2016 | $10,773 | $726,900 | $298,700 | $428,200 |
| 2015 | $10,385 | $693,700 | $287,400 | $406,300 |
Source: Public Records
Map
Nearby Homes
- 33 Chestnut St Unit 2
- 100.5 Main St Unit Q
- 96 N Main St Unit 3
- Lot 7 Weeping Willow Dr
- 5 Lewis St
- 1 Sweeney Ct
- 52 Salem St
- 181 High St Unit 1
- 170 Haverhill St Unit 138
- 1 Longwood Dr Unit 105
- 1 Longwood Dr Unit 5
- 2 Powder Mill Square Unit 2B
- 35 Peters St
- 124 Quail Run Rd
- 136 Quail Run Rd
- 70 Washington Park Dr Unit 6
- 104 Salem St
- 11 Cuba St
- 42 Hewitt Ave
- 3 Torr St
- 165 Summer St
- 153 Summer St
- 6 Rogers Brook W
- 8 Rogers Brook W
- 167 Summer St
- 167 Summer St Unit 167
- 158 Summer St
- 148 Summer St
- 4 Rogers Brook W
- 147 Summer St
- 166 Summer St
- 169 Summer St
- 169 Summer St Unit n/a
- 9 Rogers Brook W
- 144 Summer St
- 7 Rogers Brook W
- 10 Rogers Brook W
- 11 Rogers Brook W
- 5 Rogers Brook W
- 171 Summer St
Your Personal Tour Guide
Ask me questions while you tour the home.