159 SW Florence Ave Unit 46 Gresham, OR 97080
Hollybrook NeighborhoodEstimated Value: $213,000 - $243,000
2
Beds
1
Bath
852
Sq Ft
$268/Sq Ft
Est. Value
About This Home
This home is located at 159 SW Florence Ave Unit 46, Gresham, OR 97080 and is currently estimated at $227,957, approximately $267 per square foot. 159 SW Florence Ave Unit 46 is a home located in Multnomah County with nearby schools including Dexter McCarty Middle School, Gresham High School, and Gresham Arthur Academy.
Ownership History
Date
Name
Owned For
Owner Type
Purchase Details
Closed on
Nov 14, 2012
Sold by
Shaw Cindy L
Bought by
Keyser William
Current Estimated Value
Home Financials for this Owner
Home Financials are based on the most recent Mortgage that was taken out on this home.
Original Mortgage
$69,910
Outstanding Balance
$47,814
Interest Rate
3.25%
Mortgage Type
FHA
Estimated Equity
$180,143
Purchase Details
Closed on
Jul 9, 1998
Sold by
Jendritza Rebecca
Bought by
Shaw Cindy L
Home Financials for this Owner
Home Financials are based on the most recent Mortgage that was taken out on this home.
Original Mortgage
$66,300
Interest Rate
7.03%
Purchase Details
Closed on
Jun 21, 1995
Sold by
Florence Terrace Investors Ltd Prtnrshp
Bought by
Thompson Keith W and Thompson Jeannine R
Create a Home Valuation Report for This Property
The Home Valuation Report is an in-depth analysis detailing your home's value as well as a comparison with similar homes in the area
Home Values in the Area
Average Home Value in this Area
Purchase History
| Date | Buyer | Sale Price | Title Company |
|---|---|---|---|
| Keyser William | $70,000 | First American | |
| Shaw Cindy L | $78,000 | Chicago Title Insurance Co | |
| Thompson Keith W | $60,000 | Oregon Title Insurance Compa |
Source: Public Records
Mortgage History
| Date | Status | Borrower | Loan Amount |
|---|---|---|---|
| Open | Keyser William | $69,910 | |
| Previous Owner | Shaw Cindy L | $66,300 |
Source: Public Records
Tax History
| Year | Tax Paid | Tax Assessment Tax Assessment Total Assessment is a certain percentage of the fair market value that is determined by local assessors to be the total taxable value of land and additions on the property. | Land | Improvement |
|---|---|---|---|---|
| 2025 | $2,261 | $111,100 | -- | $111,100 |
| 2024 | $2,164 | $107,870 | -- | $107,870 |
| 2023 | $1,972 | $104,730 | $0 | $104,730 |
| 2022 | $1,917 | $101,680 | $0 | $0 |
| 2021 | $1,868 | $98,720 | $0 | $0 |
| 2020 | $1,758 | $95,850 | $0 | $0 |
| 2019 | $1,712 | $93,060 | $0 | $0 |
| 2018 | $1,632 | $90,350 | $0 | $0 |
| 2017 | $1,566 | $87,720 | $0 | $0 |
| 2016 | $1,381 | $85,170 | $0 | $0 |
Source: Public Records
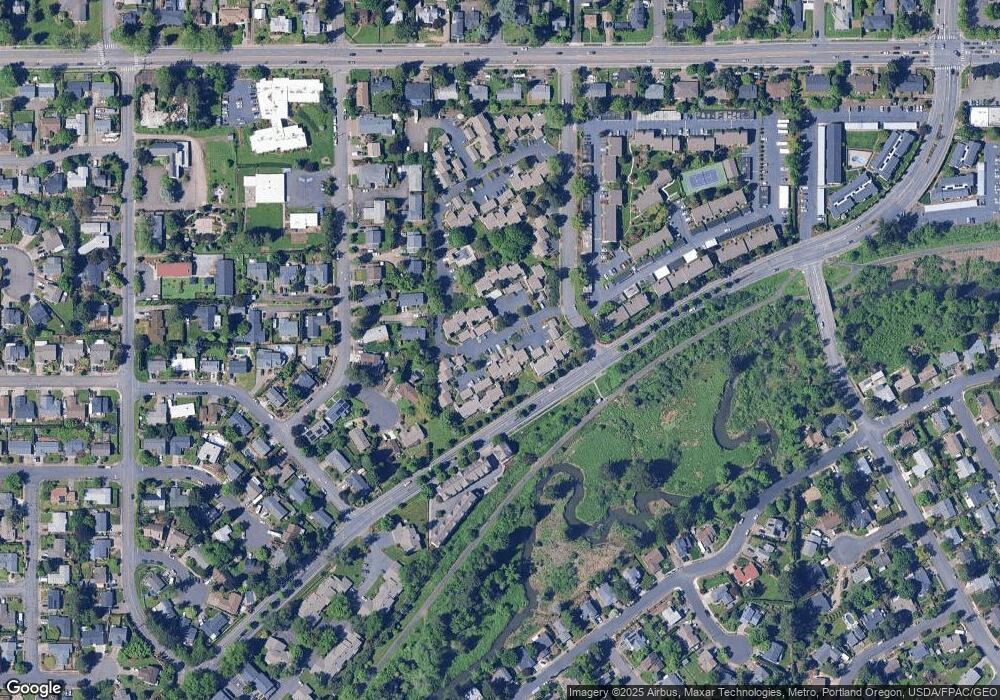
Map
Nearby Homes
- 159 SW Florence Ave Unit 64
- 159 SW Florence Ave
- 1113 W Powell Blvd
- 645 W Powell Blvd
- 638 SW 7th St
- 44 SW Birdsdale Dr
- 765 NW Angeline Ave
- 1325 NW 9th St
- 994 NW Wallula Ave
- 2095 NW 3rd St
- 1745 NW 7th Place
- 1175 SW Chastain Dr
- 0 NE 5th St
- 230 NW Mawrcrest Ave
- 236 NW Mawrcrest Ave
- 256 NW Mawrcrest Ave
- 1407 SW Walters Dr
- 21 NW Mawrcrest Ave
- 284 NW Mawrcrest Ave
- 296 NW Mawrcrest Ave
- 159 SW Florence Ave Unit B6
- 159 SW Florence Ave Unit B9
- 159 SW Florence Ave Unit B8
- 159 SW Florence Ave Unit B7
- 159 SW Florence Ave Unit 30
- 159 SW Florence Ave Unit 18
- 159 SW Florence Ave Unit 78
- 159 SW Florence Ave Unit 77
- 159 SW Florence Ave Unit 76
- 159 SW Florence Ave Unit 75
- 159 SW Florence Ave Unit 74
- 159 SW Florence Ave Unit 73
- 159 SW Florence Ave Unit 72
- 159 SW Florence Ave Unit 71
- 159 SW Florence Ave Unit 70
- 159 SW Florence Ave Unit 69
- 159 SW Florence Ave Unit 68
- 159 SW Florence Ave Unit 66
- 159 SW Florence Ave Unit 65
- 159 SW Florence Ave Unit 63
Your Personal Tour Guide
Ask me questions while you tour the home.