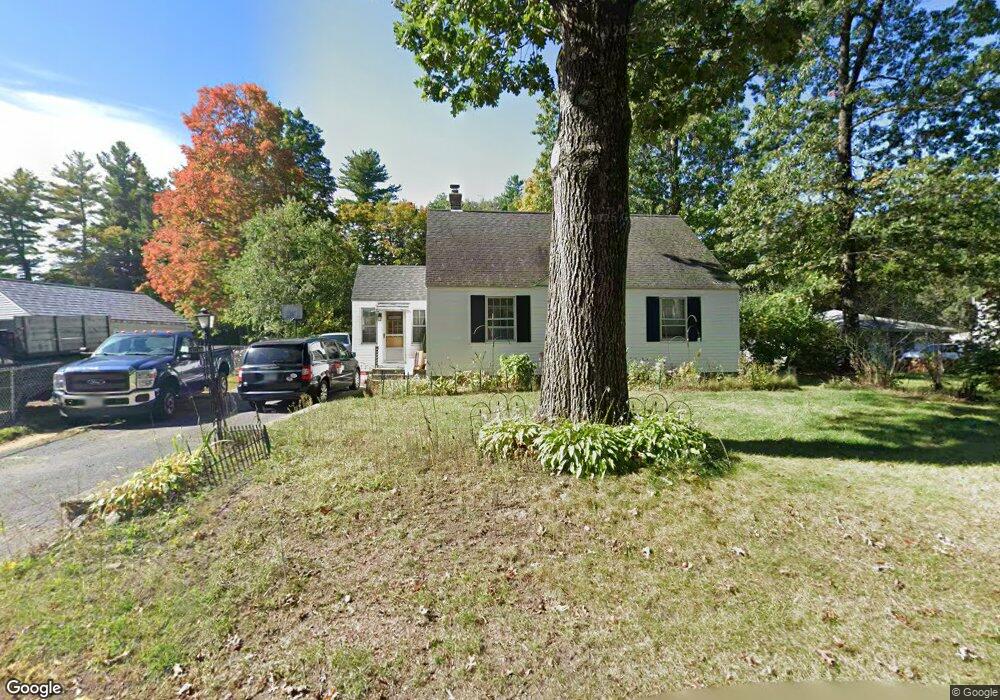
159 Sylvan Rd Lancaster, MA 01523
Estimated Value: $391,000 - $448,000
4
Beds
1
Bath
1,356
Sq Ft
$313/Sq Ft
Est. Value
About This Home
This home is located at 159 Sylvan Rd, Lancaster, MA 01523 and is currently estimated at $424,312, approximately $312 per square foot. 159 Sylvan Rd is a home located in Worcester County with nearby schools including Mary Rowlandson Elementary School, Luther Burbank Middle School, and Nashoba Regional High School.
Ownership History
Date
Name
Owned For
Owner Type
Purchase Details
Closed on
Sep 23, 2009
Sold by
Kingdon Dolores and Kilcoyne Rose Marie
Bought by
Leclair Michael J and Leclair Jennifer
Current Estimated Value
Home Financials for this Owner
Home Financials are based on the most recent Mortgage that was taken out on this home.
Original Mortgage
$194,904
Outstanding Balance
$128,241
Interest Rate
5.31%
Mortgage Type
Purchase Money Mortgage
Estimated Equity
$296,071
Create a Home Valuation Report for This Property
The Home Valuation Report is an in-depth analysis detailing your home's value as well as a comparison with similar homes in the area
Home Values in the Area
Average Home Value in this Area
Purchase History
| Date | Buyer | Sale Price | Title Company |
|---|---|---|---|
| Leclair Michael J | $198,500 | -- |
Source: Public Records
Mortgage History
| Date | Status | Borrower | Loan Amount |
|---|---|---|---|
| Open | Leclair Michael J | $194,904 |
Source: Public Records
Tax History
| Year | Tax Paid | Tax Assessment Tax Assessment Total Assessment is a certain percentage of the fair market value that is determined by local assessors to be the total taxable value of land and additions on the property. | Land | Improvement |
|---|---|---|---|---|
| 2025 | $4,631 | $286,600 | $99,500 | $187,100 |
| 2024 | $4,643 | $265,900 | $92,600 | $173,300 |
| 2023 | $4,373 | $254,400 | $84,200 | $170,200 |
| 2022 | $4,147 | $213,200 | $87,600 | $125,600 |
| 2021 | $4,074 | $203,900 | $87,600 | $116,300 |
| 2020 | $3,994 | $201,200 | $87,600 | $113,600 |
| 2019 | $3,828 | $193,800 | $87,600 | $106,200 |
| 2018 | $3,716 | $186,000 | $87,600 | $98,400 |
| 2016 | $3,462 | $177,100 | $86,800 | $90,300 |
| 2015 | $3,309 | $176,400 | $86,800 | $89,600 |
| 2014 | $3,232 | $170,900 | $86,800 | $84,100 |
Source: Public Records
Map
Nearby Homes
- 76 Mill St Unit 3
- 73 Prescott St
- 0 Parker Rd
- 132 Kilbourn Rd
- 54 S Meadow Rd
- 37 Sterling St
- 5 Catherine St
- 508 High St
- 20 Willow St
- 18 Highfield Dr
- 93 Forest St
- 719 Main St
- 57 Clark St
- 51 Rigby St
- 12 Woodruff Rd
- 46 Woodruff Rd
- 55 Sterling St Unit 306
- 55 Sterling St Unit 312
- 55 Sterling St Unit 314
- 55 Sterling St Unit 212
Your Personal Tour Guide
Ask me questions while you tour the home.