Estimated Value: $1,156,000 - $1,409,000
5
Beds
3
Baths
3,500
Sq Ft
$373/Sq Ft
Est. Value
About This Home
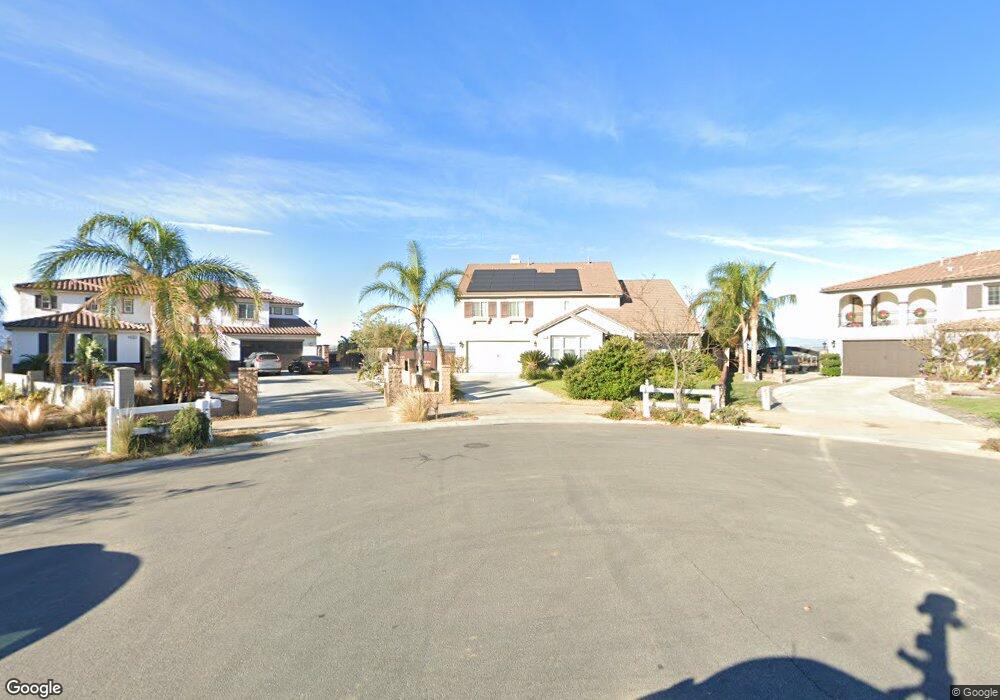
This home is located at 159 Trakehner Place, Norco, CA 92860 and is currently estimated at $1,304,582, approximately $372 per square foot. 159 Trakehner Place is a home located in Riverside County with nearby schools including Riverview Elementary School, Norco Intermediate School, and Norco High School.
Ownership History
Date
Name
Owned For
Owner Type
Purchase Details
Closed on
Mar 12, 2010
Sold by
Reo Properties Two Lp
Bought by
Gwinn Stephen and Gwinn Stephanie
Current Estimated Value
Home Financials for this Owner
Home Financials are based on the most recent Mortgage that was taken out on this home.
Original Mortgage
$440,000
Outstanding Balance
$290,601
Interest Rate
4.91%
Mortgage Type
New Conventional
Estimated Equity
$1,013,981
Purchase Details
Closed on
Nov 13, 2009
Sold by
Nguyen Thang
Bought by
Reo Properties Two Lp
Purchase Details
Closed on
Aug 23, 2005
Sold by
Standard Pacific Corp
Bought by
Nguyen Thang
Home Financials for this Owner
Home Financials are based on the most recent Mortgage that was taken out on this home.
Original Mortgage
$719,120
Interest Rate
7.47%
Mortgage Type
Purchase Money Mortgage
Create a Home Valuation Report for This Property
The Home Valuation Report is an in-depth analysis detailing your home's value as well as a comparison with similar homes in the area
Home Values in the Area
Average Home Value in this Area
Purchase History
| Date | Buyer | Sale Price | Title Company |
|---|---|---|---|
| Gwinn Stephen | $550,000 | Investors Title Company | |
| Reo Properties Two Lp | $377,900 | Accommodation | |
| Nguyen Thang | $919,000 | Fidelity National Title Buil |
Source: Public Records
Mortgage History
| Date | Status | Borrower | Loan Amount |
|---|---|---|---|
| Open | Gwinn Stephen | $440,000 | |
| Previous Owner | Nguyen Thang | $719,120 |
Source: Public Records
Tax History
| Year | Tax Paid | Tax Assessment Tax Assessment Total Assessment is a certain percentage of the fair market value that is determined by local assessors to be the total taxable value of land and additions on the property. | Land | Improvement |
|---|---|---|---|---|
| 2025 | $13,871 | $719,712 | $193,613 | $526,099 |
| 2023 | $13,871 | $691,767 | $186,096 | $505,671 |
| 2022 | $13,387 | $678,204 | $182,448 | $495,756 |
| 2021 | $13,086 | $664,907 | $178,871 | $486,036 |
| 2020 | $12,909 | $658,090 | $177,037 | $481,053 |
| 2019 | $12,625 | $645,187 | $173,566 | $471,621 |
| 2018 | $12,300 | $632,537 | $170,164 | $462,373 |
| 2017 | $12,585 | $620,135 | $166,828 | $453,307 |
| 2016 | $12,529 | $607,976 | $163,557 | $444,419 |
| 2015 | $12,421 | $598,846 | $161,101 | $437,745 |
| 2014 | $12,141 | $587,118 | $157,947 | $429,171 |
Source: Public Records
Map
Nearby Homes
- 0 Southfork Dr
- 200 Pompano Place
- 221 East St
- 3101 Curly Horse Way
- 3730 California Ave
- 460 Bareback Ct
- 3563 Pedley Ave
- 2920 Crestview Dr
- 4130 Mount Verde Dr
- 3475 Hillside Ave
- 4210 Crestview Dr
- 3004 Dapplegray Ln
- 640 Vaughan St
- 5481 Peacock Ln
- 361 Spur Dr
- 2993 Hillside Ave
- 5444 Peacock Ln
- 5401 College Ave
- 2841 Huerta Way
- 925 5th St
- 149 Trakehner Place
- 160 Trakehner Place
- 139 Trakehner Place
- 150 Trakehner Place
- 140 Trakehner Place
- 129 Trakehner Place
- 130 Trakehner Place
- 3469 Southfork Dr
- 119 Trakehner Place
- 3447 Southfork Dr
- 120 Trakehner Place
- 149 Paint Ct
- 109 Trakehner Place
- 3550 Crestview Dr
- 110 Trakehner Place
- 3421 Southfork Dr
- 3560 Crestview Dr
- 3540 Crestview Dr
- 139 Paint Ct
- 159 Paint Ct
Your Personal Tour Guide
Ask me questions while you tour the home.