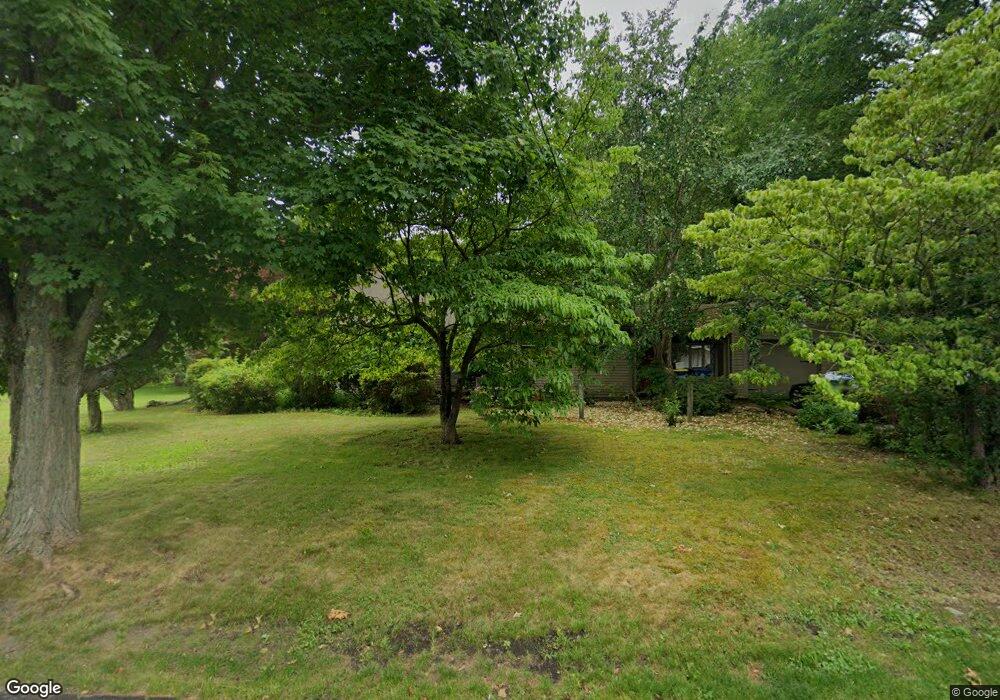
159 Union St East Bridgewater, MA 02333
Estimated Value: $403,000 - $519,000
3
Beds
2
Baths
1,082
Sq Ft
$437/Sq Ft
Est. Value
About This Home
This home is located at 159 Union St, East Bridgewater, MA 02333 and is currently estimated at $472,714, approximately $436 per square foot. 159 Union St is a home located in Plymouth County with nearby schools including Central Elementary School, Gordon W Mitchell Middle School, and East Bridgewater Jr./Sr. High School.
Ownership History
Date
Name
Owned For
Owner Type
Purchase Details
Closed on
Feb 9, 2001
Sold by
Union St Rt
Bought by
159 Union St Rt
Current Estimated Value
Home Financials for this Owner
Home Financials are based on the most recent Mortgage that was taken out on this home.
Original Mortgage
$100,000
Outstanding Balance
$36,257
Interest Rate
7.13%
Mortgage Type
Purchase Money Mortgage
Estimated Equity
$436,457
Purchase Details
Closed on
Dec 31, 1993
Sold by
Woodlawn Rt
Bought by
Union St Rt
Create a Home Valuation Report for This Property
The Home Valuation Report is an in-depth analysis detailing your home's value as well as a comparison with similar homes in the area
Home Values in the Area
Average Home Value in this Area
Purchase History
| Date | Buyer | Sale Price | Title Company |
|---|---|---|---|
| 159 Union St Rt | $155,000 | -- | |
| Union St Rt | $38,000 | -- |
Source: Public Records
Mortgage History
| Date | Status | Borrower | Loan Amount |
|---|---|---|---|
| Open | Union St Rt | $100,000 |
Source: Public Records
Tax History Compared to Growth
Tax History
| Year | Tax Paid | Tax Assessment Tax Assessment Total Assessment is a certain percentage of the fair market value that is determined by local assessors to be the total taxable value of land and additions on the property. | Land | Improvement |
|---|---|---|---|---|
| 2025 | $5,543 | $405,500 | $177,800 | $227,700 |
| 2024 | $5,446 | $393,500 | $171,000 | $222,500 |
| 2023 | $5,409 | $374,300 | $171,000 | $203,300 |
| 2022 | $5,432 | $348,200 | $155,500 | $192,700 |
| 2021 | $5,289 | $310,200 | $149,400 | $160,800 |
| 2020 | $5,196 | $300,500 | $143,700 | $156,800 |
| 2019 | $5,036 | $286,800 | $137,300 | $149,500 |
| 2018 | $10,141 | $267,000 | $137,300 | $129,700 |
| 2017 | $4,659 | $254,600 | $131,000 | $123,600 |
| 2016 | $4,540 | $250,000 | $131,000 | $119,000 |
| 2015 | $4,380 | $246,600 | $130,000 | $116,600 |
| 2014 | $4,205 | $242,100 | $127,300 | $114,800 |
Source: Public Records
Map
Nearby Homes
- 11 Harmony Crossing
- 41 Bedford St
- 71 Church St
- 11 Willow Ave
- 9 Hemlock Dr
- 282 Spring St
- 14 Mountain Ash Rd
- 261 Plymouth St
- 585 N Bedford St
- 611 N Bedford St
- 416 Highland St
- 407 W Union St
- 1 Simmons Place
- 446 Elm St
- 78 Crystal Water Dr
- 505 N Central St
- 217 Crystal Water Dr
- 182 Crystal Water Dr Unit 182
- 455 Plymouth St
- 28 Brookbend Way E