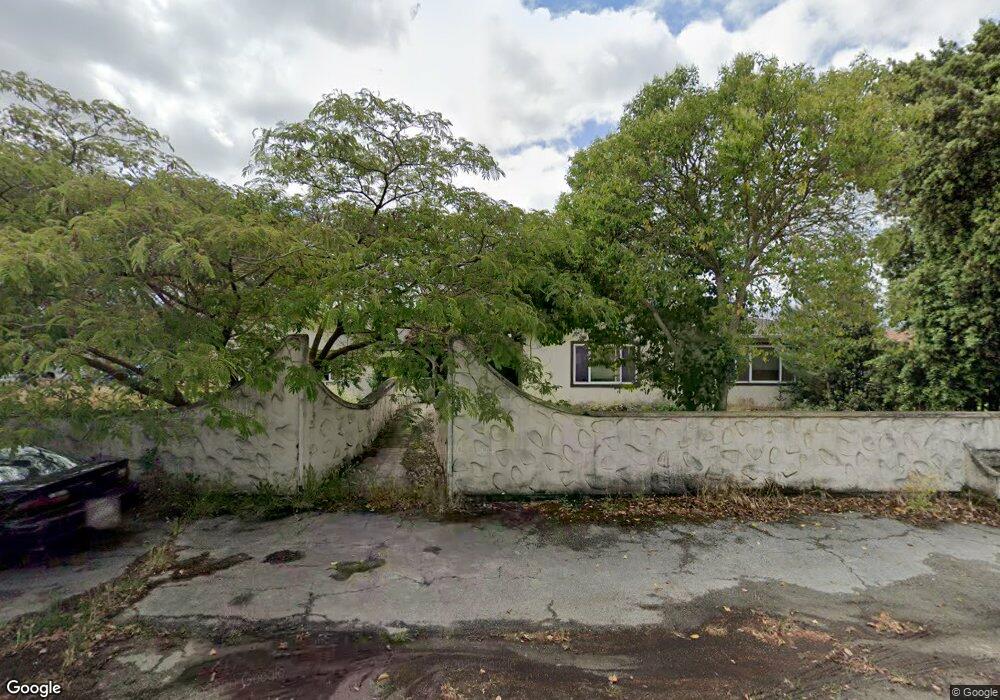
1590 Jennifer Ln Gilroy, CA 95020
Estimated Value: $1,461,000 - $1,973,000
4
Beds
4
Baths
1,568
Sq Ft
$1,057/Sq Ft
Est. Value
About This Home
This home is located at 1590 Jennifer Ln, Gilroy, CA 95020 and is currently estimated at $1,656,958, approximately $1,056 per square foot. 1590 Jennifer Ln is a home located in Santa Clara County with nearby schools including Rucker Elementary School, Solorsano Middle School, and Christopher High School.
Ownership History
Date
Name
Owned For
Owner Type
Purchase Details
Closed on
Feb 3, 2011
Sold by
Olsen Patrick A
Bought by
Olsen Patrick A
Current Estimated Value
Purchase Details
Closed on
Nov 14, 1997
Sold by
Davidson Daniel F
Bought by
Olsen Patrick A
Home Financials for this Owner
Home Financials are based on the most recent Mortgage that was taken out on this home.
Original Mortgage
$319,000
Outstanding Balance
$59,241
Interest Rate
8.75%
Mortgage Type
Purchase Money Mortgage
Estimated Equity
$1,597,717
Purchase Details
Closed on
May 2, 1994
Sold by
Keycorp Mtg Inc
Bought by
Davidson Daniel F
Home Financials for this Owner
Home Financials are based on the most recent Mortgage that was taken out on this home.
Original Mortgage
$196,000
Interest Rate
6.12%
Mortgage Type
Purchase Money Mortgage
Purchase Details
Closed on
Oct 21, 1992
Sold by
Security Pacific National Bank
Bought by
Keycorp Mtg Inc
Create a Home Valuation Report for This Property
The Home Valuation Report is an in-depth analysis detailing your home's value as well as a comparison with similar homes in the area
Home Values in the Area
Average Home Value in this Area
Purchase History
| Date | Buyer | Sale Price | Title Company |
|---|---|---|---|
| Olsen Patrick A | -- | None Available | |
| Olsen Patrick A | $419,000 | Chicago Title Co | |
| Davidson Daniel F | $255,000 | First American Title Grnty C | |
| Keycorp Mtg Inc | $231,500 | -- |
Source: Public Records
Mortgage History
| Date | Status | Borrower | Loan Amount |
|---|---|---|---|
| Open | Olsen Patrick A | $319,000 | |
| Previous Owner | Davidson Daniel F | $196,000 |
Source: Public Records
Tax History Compared to Growth
Tax History
| Year | Tax Paid | Tax Assessment Tax Assessment Total Assessment is a certain percentage of the fair market value that is determined by local assessors to be the total taxable value of land and additions on the property. | Land | Improvement |
|---|---|---|---|---|
| 2025 | $8,129 | $669,020 | $334,510 | $334,510 |
| 2024 | $8,129 | $655,902 | $327,951 | $327,951 |
| 2023 | $8,661 | $643,042 | $321,521 | $321,521 |
| 2022 | $7,829 | $630,434 | $315,217 | $315,217 |
| 2021 | $7,792 | $618,074 | $309,037 | $309,037 |
| 2020 | $7,697 | $611,738 | $305,869 | $305,869 |
| 2019 | $7,620 | $599,744 | $299,872 | $299,872 |
| 2018 | $7,081 | $587,986 | $293,993 | $293,993 |
| 2017 | $7,229 | $576,458 | $288,229 | $288,229 |
| 2016 | $7,076 | $565,156 | $282,578 | $282,578 |
| 2015 | $6,677 | $556,668 | $278,334 | $278,334 |
| 2014 | $6,653 | $545,764 | $272,882 | $272,882 |
Source: Public Records
Map
Nearby Homes
- 11840 Foothill Ave
- 10980 New Ave
- 1925 Church Ave
- 2055 Rucker Ave
- 145 Masten Ave
- 12467 Creekview Ct
- 310 Lena Ave
- 12550 Center Ave
- 2525 Bridle Path Dr
- 2115 Gwinn Ave
- 10055 Foothill Ave
- 13035 Center Ave
- 0002 Buena Vista Ave
- 0 Buena Vista Ave
- 9560 Via Del Oro
- 12320 Highland Estates Ln
- 905 E San Martin Ave
- 12315 Harding Ave
- 13640 Sycamore Ave
- 13705 Sycamore Ave
- 1600 Jennifer Ln
- 1580 Jennifer Ln
- 1595 Jennifer Ln
- 1605 Jennifer Ln
- 11145 Foothill Ave
- 1585 Jennifer Ln
- 1615 Jennifer Ln
- 1610 Jennifer Ln
- 11165 Foothill Ave
- 1625 Jennifer Ln
- 11425 Foothill Ave
- 11300 Center Ave
- 11115 Foothill Ave
- 11115 Foothill Ave
- 11465 Foothill Ave
- 1465 Venturella Dr
- 11200 Foothill Ave
- 11107 Foothill Ave
- 11035 Foothill Ave
- 11280 Center Ave