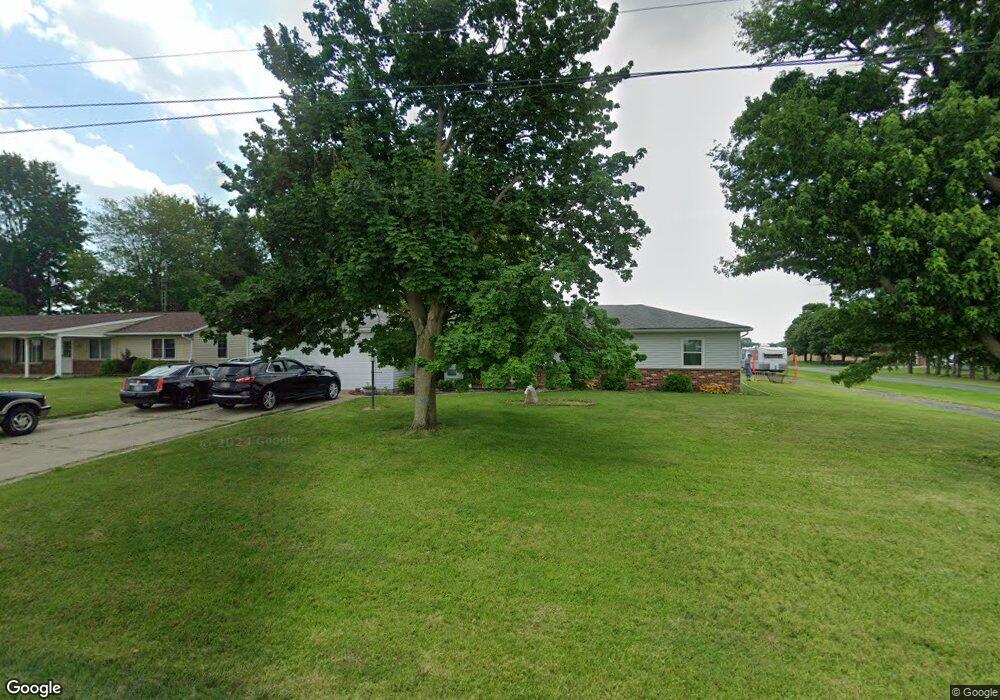
1590 Smith Rd Fremont, OH 43420
Estimated Value: $211,000 - $291,000
3
Beds
2
Baths
2,016
Sq Ft
$116/Sq Ft
Est. Value
About This Home
This home is located at 1590 Smith Rd, Fremont, OH 43420 and is currently estimated at $233,666, approximately $115 per square foot. 1590 Smith Rd is a home located in Sandusky County with nearby schools including Fremont Ross High School, Sacred Heart School, and Temple Christian Academy.
Ownership History
Date
Name
Owned For
Owner Type
Purchase Details
Closed on
Jun 10, 2021
Sold by
Mills Angela M
Bought by
Mills Jonathan M
Current Estimated Value
Purchase Details
Closed on
Dec 28, 2020
Sold by
Kuyken Thelma I
Bought by
Shriver Jonathan M and Mills Angela M
Home Financials for this Owner
Home Financials are based on the most recent Mortgage that was taken out on this home.
Original Mortgage
$112,000
Interest Rate
2.8%
Mortgage Type
New Conventional
Purchase Details
Closed on
Oct 17, 2017
Sold by
Kuyken Thelma I
Bought by
Toeppe Mary S and Kuyken Michael L
Purchase Details
Closed on
Oct 11, 2017
Sold by
Kuyken Thelma I
Bought by
Kuyken Thelma L
Purchase Details
Closed on
Feb 1, 1992
Bought by
Kuyken Thelma I Trustee
Purchase Details
Closed on
Jun 1, 1986
Bought by
Kuyken Thelma I Trustee
Create a Home Valuation Report for This Property
The Home Valuation Report is an in-depth analysis detailing your home's value as well as a comparison with similar homes in the area
Home Values in the Area
Average Home Value in this Area
Purchase History
| Date | Buyer | Sale Price | Title Company |
|---|---|---|---|
| Mills Jonathan M | $71,800 | None Available | |
| Shriver Jonathan M | $140,000 | None Available | |
| Toeppe Mary S | -- | None Available | |
| Kuyken Thelma L | -- | None Available | |
| Kuyken Thelma I Trustee | -- | -- | |
| Kuyken Thelma I Trustee | -- | -- |
Source: Public Records
Mortgage History
| Date | Status | Borrower | Loan Amount |
|---|---|---|---|
| Previous Owner | Shriver Jonathan M | $112,000 |
Source: Public Records
Tax History Compared to Growth
Tax History
| Year | Tax Paid | Tax Assessment Tax Assessment Total Assessment is a certain percentage of the fair market value that is determined by local assessors to be the total taxable value of land and additions on the property. | Land | Improvement |
|---|---|---|---|---|
| 2024 | $2,430 | $62,370 | $9,380 | $52,990 |
| 2023 | $2,430 | $50,720 | $7,630 | $43,090 |
| 2022 | $2,110 | $50,720 | $7,630 | $43,090 |
| 2021 | $2,174 | $50,720 | $7,630 | $43,090 |
| 2020 | $1,816 | $50,260 | $7,630 | $42,630 |
| 2019 | $1,814 | $50,260 | $7,630 | $42,630 |
| 2018 | $1,764 | $50,260 | $7,630 | $42,630 |
| 2017 | $1,654 | $47,460 | $7,630 | $39,830 |
| 2016 | $1,450 | $47,460 | $7,630 | $39,830 |
| 2015 | $1,426 | $47,460 | $7,630 | $39,830 |
| 2014 | $1,527 | $48,480 | $7,700 | $40,780 |
| 2013 | $1,496 | $48,480 | $7,700 | $40,780 |
Source: Public Records
Map
Nearby Homes
- 800 Lawndale Dr
- 546 Oaklawn Ave
- 1526 Sunrise Blvd
- 933 E Cole Rd
- 18 Katlyn Dr
- 0 S Buchanan St
- 600 S Buchanan St
- 309 S Collinwood Blvd
- 314 S Collinwood Blvd
- 906 Amsden Blvd
- 2248 E State St
- 1014 S County Road 198
- 199 Saint Thomas Dr
- 1826 Morrison Rd
- 318 Ethan Dr
- 315 Ethan Dr
- 1832 Myrtle St
- 251 Saint Paul Dr
- 230 N Pennsylvania Ave
- 263 Saint Paul Dr