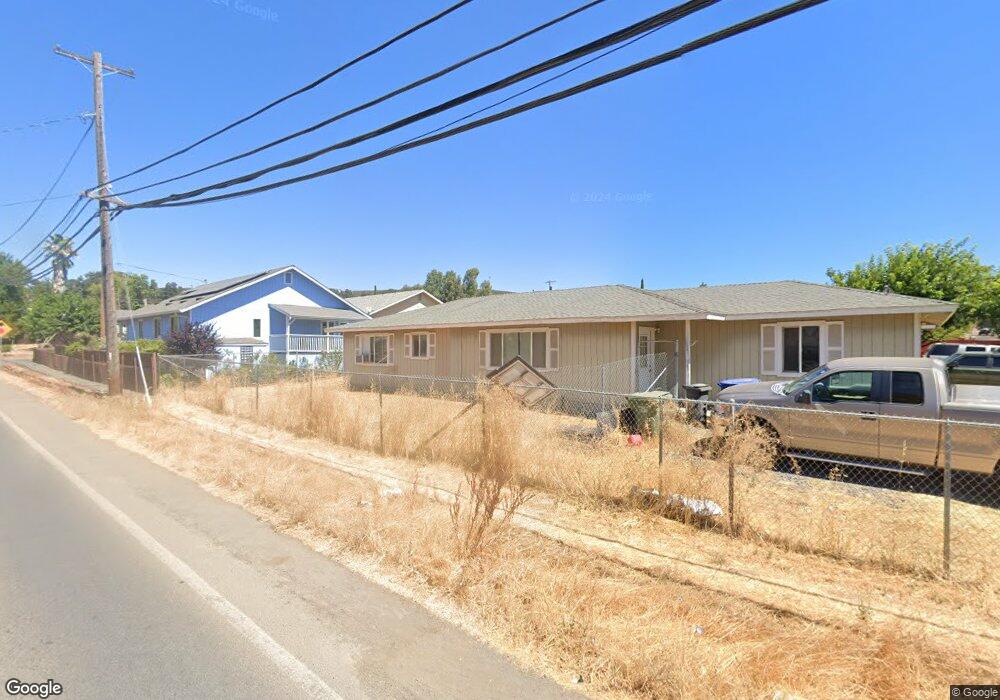
15904 38th Ave Clearlake, CA 95422
Estimated Value: $256,572 - $312,000
3
Beds
2
Baths
1,098
Sq Ft
$261/Sq Ft
Est. Value
About This Home
This home is located at 15904 38th Ave, Clearlake, CA 95422 and is currently estimated at $286,643, approximately $261 per square foot. 15904 38th Ave is a home located in Lake County with nearby schools including Lower Lake High School, Jeannies Learning Garden, and Clearlake Seventh-day Adventist Christian School.
Ownership History
Date
Name
Owned For
Owner Type
Purchase Details
Closed on
Apr 28, 2022
Sold by
Gene Richard Atkins Revocable Living Tru and Johnson Ronni Leigh
Bought by
Johnson Ronni Leigh
Current Estimated Value
Purchase Details
Closed on
Sep 29, 2006
Sold by
Atkins Gene
Bought by
Atkins Gene Richard
Purchase Details
Closed on
Feb 18, 2004
Sold by
Ross Robin E
Bought by
Atkins Gene
Purchase Details
Closed on
Feb 5, 2004
Sold by
Roggio Robert F
Bought by
Ross Robin E
Create a Home Valuation Report for This Property
The Home Valuation Report is an in-depth analysis detailing your home's value as well as a comparison with similar homes in the area
Home Values in the Area
Average Home Value in this Area
Purchase History
| Date | Buyer | Sale Price | Title Company |
|---|---|---|---|
| Johnson Ronni Leigh | -- | None Listed On Document | |
| Atkins Gene Richard | -- | None Available | |
| Atkins Gene | $10,000 | -- | |
| Ross Robin E | -- | -- |
Source: Public Records
Tax History Compared to Growth
Tax History
| Year | Tax Paid | Tax Assessment Tax Assessment Total Assessment is a certain percentage of the fair market value that is determined by local assessors to be the total taxable value of land and additions on the property. | Land | Improvement |
|---|---|---|---|---|
| 2025 | $2,587 | $216,181 | $7,101 | $209,080 |
| 2024 | $2,557 | $211,943 | $6,962 | $204,981 |
| 2023 | $2,526 | $207,788 | $6,826 | $200,962 |
| 2022 | $2,400 | $203,715 | $6,693 | $197,022 |
| 2021 | $1,711 | $135,000 | $10,000 | $125,000 |
| 2020 | $1,718 | $135,000 | $10,000 | $125,000 |
| 2019 | $1,676 | $105,000 | $10,000 | $95,000 |
| 2018 | $1,358 | $105,000 | $10,000 | $95,000 |
| 2017 | $1,319 | $105,000 | $10,000 | $95,000 |
| 2016 | $1,227 | $105,000 | $10,000 | $95,000 |
| 2015 | $1,223 | $105,000 | $10,000 | $95,000 |
| 2014 | $1,221 | $105,000 | $10,000 | $95,000 |
Source: Public Records
Map
Nearby Homes