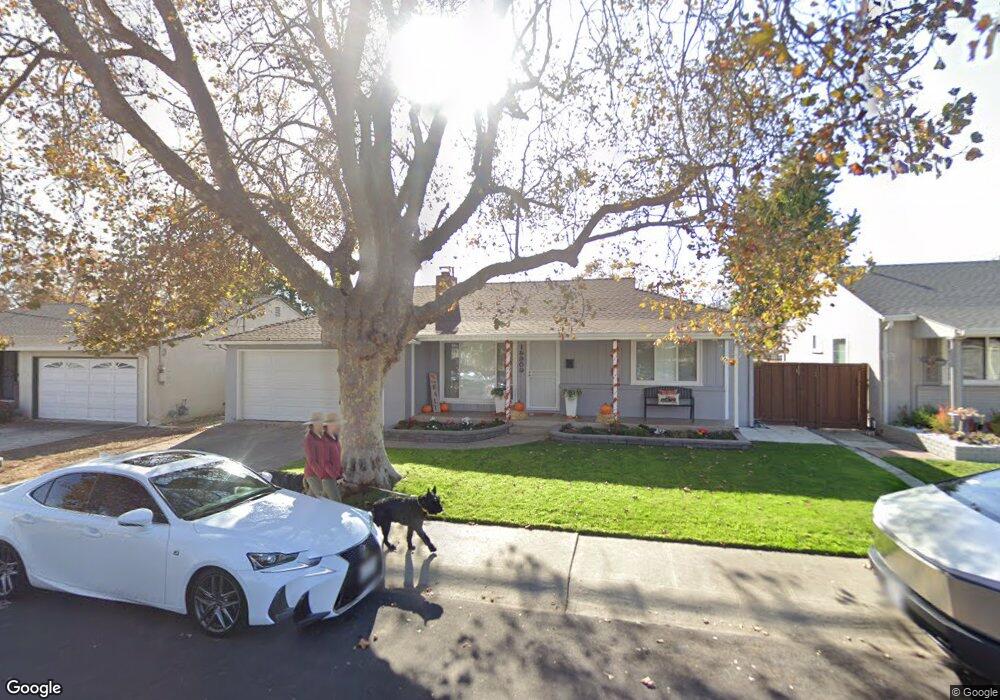
15909 Via Cordoba San Lorenzo, CA 94580
Estimated Value: $815,391 - $879,000
3
Beds
2
Baths
1,451
Sq Ft
$588/Sq Ft
Est. Value
About This Home
This home is located at 15909 Via Cordoba, San Lorenzo, CA 94580 and is currently estimated at $852,848, approximately $587 per square foot. 15909 Via Cordoba is a home located in Alameda County with nearby schools including Grant Elementary School, Washington Manor Middle School, and San Lorenzo High School.
Ownership History
Date
Name
Owned For
Owner Type
Purchase Details
Closed on
Dec 13, 2019
Sold by
Lagin Maria S D and The Mary E Dye Revocable Trust
Bought by
Gomez Antonio and Gomez Emilce
Current Estimated Value
Home Financials for this Owner
Home Financials are based on the most recent Mortgage that was taken out on this home.
Original Mortgage
$660,357
Outstanding Balance
$582,428
Interest Rate
3.62%
Mortgage Type
FHA
Estimated Equity
$270,420
Purchase Details
Closed on
May 22, 2014
Sold by
Dye Mary E
Bought by
Dye Mary E and Mary E Dye Revocable Trust
Purchase Details
Closed on
Mar 1, 2001
Sold by
Dye John Robert and Dye Mary Elizabeth
Bought by
Dye Mary Elizabeth
Home Financials for this Owner
Home Financials are based on the most recent Mortgage that was taken out on this home.
Original Mortgage
$110,000
Interest Rate
7.11%
Purchase Details
Closed on
Nov 17, 2000
Sold by
Dye John Robert and Dye Mary Elizabeth
Bought by
Dye John Robert and Dye Mary Elizabeth
Create a Home Valuation Report for This Property
The Home Valuation Report is an in-depth analysis detailing your home's value as well as a comparison with similar homes in the area
Home Values in the Area
Average Home Value in this Area
Purchase History
| Date | Buyer | Sale Price | Title Company |
|---|---|---|---|
| Gomez Antonio | $706,000 | Old Republic Title Company | |
| Dye Mary E | -- | None Available | |
| Dye Mary Elizabeth | -- | First California Title Compa | |
| Dye John Robert | -- | -- |
Source: Public Records
Mortgage History
| Date | Status | Borrower | Loan Amount |
|---|---|---|---|
| Open | Gomez Antonio | $660,357 | |
| Previous Owner | Dye Mary Elizabeth | $110,000 |
Source: Public Records
Tax History Compared to Growth
Tax History
| Year | Tax Paid | Tax Assessment Tax Assessment Total Assessment is a certain percentage of the fair market value that is determined by local assessors to be the total taxable value of land and additions on the property. | Land | Improvement |
|---|---|---|---|---|
| 2025 | $10,031 | $772,101 | $231,630 | $540,471 |
| 2024 | $10,031 | $756,965 | $227,089 | $529,876 |
| 2023 | $9,624 | $742,125 | $222,637 | $519,488 |
| 2022 | $9,492 | $727,574 | $218,272 | $509,302 |
| 2021 | $9,237 | $713,313 | $213,994 | $499,319 |
| 2020 | $9,046 | $706,000 | $211,800 | $494,200 |
| 2019 | $3,582 | $250,951 | $75,235 | $175,716 |
| 2018 | $3,438 | $246,031 | $73,760 | $172,271 |
| 2017 | $3,283 | $241,208 | $72,314 | $168,894 |
| 2016 | $3,129 | $236,479 | $70,896 | $165,583 |
| 2015 | $3,058 | $232,929 | $69,832 | $163,097 |
| 2014 | $3,012 | $228,367 | $68,464 | $159,903 |
Source: Public Records
Map
Nearby Homes
- 181 E Lewelling Blvd
- 179 Loma Verde Dr
- 15609 Ronda St
- 15958 Via Descanso
- 263 Ano Ave
- 16829 Daryl Ave
- 17779 Rainier Ave
- 15867 Hesperian Blvd
- 17754 Meekland Ave Unit 1
- 15539 Usher St
- 15540 Hesperian Blvd
- 16960 Westerman Ct
- 920 Elgin St Unit G
- 819 Delano St
- 638 Paseo Del Rio
- 18905 Standish Ave
- 710 Videll St
- 16011 Via Conejo
- 19539 Meekland Ave
- 19736 Times Ave
- 15915 Via Cordoba
- 15903 Via Cordoba
- 15908 Via Marlin
- 15902 Via Marlin
- 15921 Via Cordoba
- 15887 Via Cordoba
- 15912 Via Cordoba
- 15906 Via Cordoba
- 15920 Via Marlin
- 15918 Via Cordoba
- 15900 Via Cordoba
- 15927 Via Cordoba
- 15878 Via Marlin
- 15879 Via Cordoba
- 15924 Via Cordoba
- 15926 Via Marlin
- 15888 Via Cordoba
- 15905 Via Marlin
- 15933 Via Cordoba
- 15911 Via Marlin