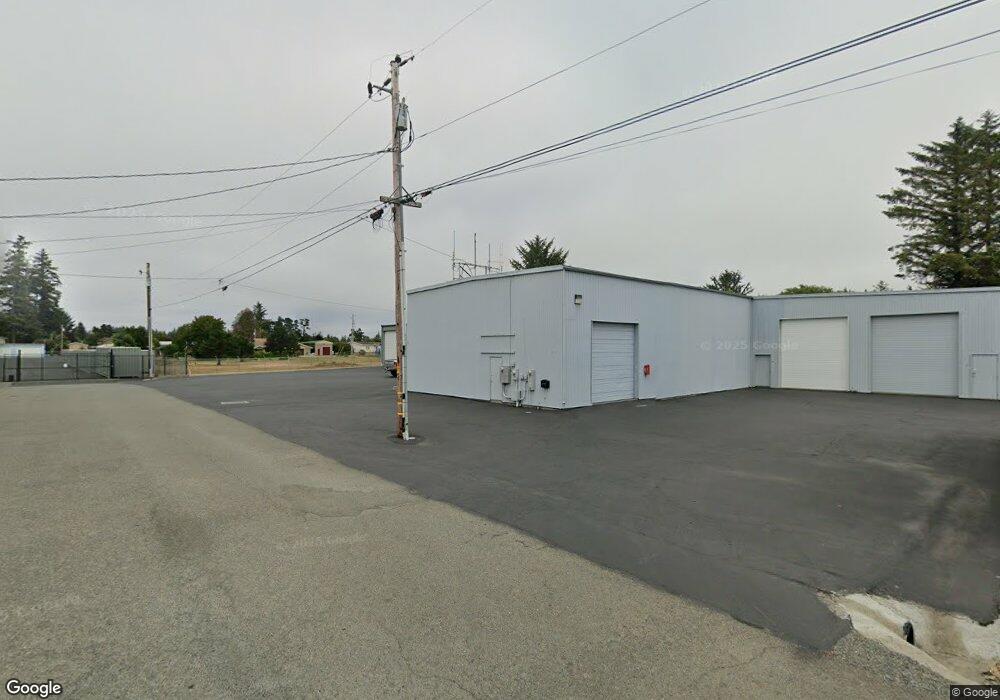
1591 California St Unit 1 Crescent City, CA 95531
Estimated Value: $68,000
--
Bed
--
Bath
4,700
Sq Ft
$14/Sq Ft
Est. Value
About This Home
This home is located at 1591 California St Unit 1, Crescent City, CA 95531 and is currently priced at $68,000, approximately $14 per square foot. 1591 California St Unit 1 is a home located in Del Norte County with nearby schools including Mary Peacock Elementary School, Crescent Elk Middle School, and Del Norte High School.
Ownership History
Date
Name
Owned For
Owner Type
Purchase Details
Closed on
Nov 14, 2021
Sold by
Benner Raymond S and Benner Pauline M
Bought by
Curren Joseph N and Curren Teasha A
Current Estimated Value
Home Financials for this Owner
Home Financials are based on the most recent Mortgage that was taken out on this home.
Original Mortgage
$133,500
Interest Rate
3.11%
Mortgage Type
Purchase Money Mortgage
Purchase Details
Closed on
May 7, 2014
Sold by
Baltis Berger Kevin Charles
Bought by
The Benner 2003 Trust
Purchase Details
Closed on
Jan 18, 2011
Sold by
Cory Charles
Bought by
Baltis Berger Kevin Charles
Purchase Details
Closed on
Mar 27, 2006
Sold by
Cory Donald
Bought by
Cory Charles
Purchase Details
Closed on
Jul 5, 2005
Sold by
Cory Charles
Bought by
Cory Charles and Cory Donald
Create a Home Valuation Report for This Property
The Home Valuation Report is an in-depth analysis detailing your home's value as well as a comparison with similar homes in the area
Home Values in the Area
Average Home Value in this Area
Purchase History
| Date | Buyer | Sale Price | Title Company |
|---|---|---|---|
| Curren Joseph N | $131,500 | Crescent Land Title Company | |
| The Benner 2003 Trust | $39,000 | Crescent Land Title Company | |
| Baltis Berger Kevin Charles | $10,000 | None Available | |
| Cory Charles | -- | None Available | |
| Cory Charles | -- | -- |
Source: Public Records
Mortgage History
| Date | Status | Borrower | Loan Amount |
|---|---|---|---|
| Previous Owner | Curren Joseph N | $133,500 |
Source: Public Records
Tax History Compared to Growth
Tax History
| Year | Tax Paid | Tax Assessment Tax Assessment Total Assessment is a certain percentage of the fair market value that is determined by local assessors to be the total taxable value of land and additions on the property. | Land | Improvement |
|---|---|---|---|---|
| 2025 | $3,384 | $297,137 | $79,590 | $217,547 |
| 2024 | $3,384 | $291,312 | $78,030 | $213,282 |
| 2023 | $3,256 | $285,600 | $76,500 | $209,100 |
| 2022 | $3,193 | $292,073 | $45,047 | $247,026 |
| 2021 | $3,201 | $286,347 | $44,164 | $242,183 |
| 2020 | $3,159 | $283,412 | $43,712 | $239,700 |
| 2019 | $570 | $42,855 | $42,855 | $0 |
| 2018 | $560 | $42,015 | $42,015 | $0 |
| 2017 | $690 | $41,192 | $41,192 | $0 |
| 2016 | $678 | $40,385 | $40,385 | $0 |
| 2015 | $638 | $39,779 | $39,779 | $0 |
| 2014 | $427 | $16,720 | $15,676 | $1,044 |
Source: Public Records
Map
Nearby Homes
- 0 E Adams Ave
- 125 W Washington Blvd
- 1718 Northcrest Dr
- 1725 Northcrest Dr
- 1760 Amador St
- 188 E Madison Ave
- 1661 Northcrest Dr Unit Space 96
- 1745 Potomac Ct
- 115 Georgetown Place
- 120 W Coolidge Ave
- 1811 Northcrest Dr
- 0000 E Washington Blvd
- 275 Chevy Chase Way
- 145 Mason Ct
- 00 Adams Ave
- 1950 Northcrest Dr
- 650 E Washington Blvd
- 650 E Washington Blvd Unit Crescent Senior Mobi
- 525 Leif Cir
- 1775 Northcrest Dr
- 1580 Oregon St
- 1576 California St
- 1560 Oregon St
- 1560 California St
- 1591 Oregon St
- 1548 California St
- 277 E Adams Ave
- 1601 Breen St
- 1530 Oregon St
- 1565 Breen St
- 1577 Breen St
- 1565 Oregon St
- 230 E Adams Ave
- 175 Arnett St
- 331 E Adams Ave
- 1533 Oregon St
- 1533 Breen St Unit 1545 Breen Street
- 1533 Breen St
- 132 E Washington Blvd
- 221 Arnett St