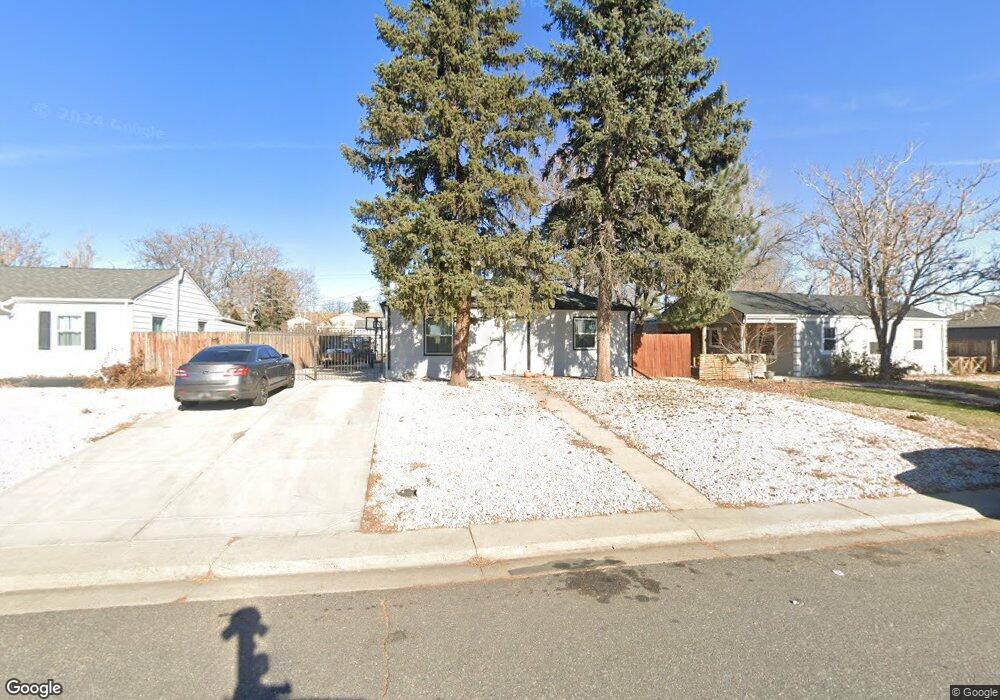
1591 W Hoye Place Denver, CO 80223
Athmar Park NeighborhoodEstimated Value: $388,000 - $429,000
2
Beds
1
Bath
709
Sq Ft
$574/Sq Ft
Est. Value
About This Home
This home is located at 1591 W Hoye Place, Denver, CO 80223 and is currently estimated at $406,779, approximately $573 per square foot. 1591 W Hoye Place is a home located in Denver County with nearby schools including Goldrick Elementary School, Grant Beacon Middle School, and Rocky Mountain Prep: Southwest.
Ownership History
Date
Name
Owned For
Owner Type
Purchase Details
Closed on
Aug 12, 2015
Sold by
Hunter Donald D
Bought by
Hunter Ean
Current Estimated Value
Home Financials for this Owner
Home Financials are based on the most recent Mortgage that was taken out on this home.
Original Mortgage
$100,000
Outstanding Balance
$78,916
Interest Rate
4.13%
Mortgage Type
New Conventional
Estimated Equity
$327,863
Purchase Details
Closed on
Jul 8, 2015
Sold by
Hunter Donald D and Winter Gloria L
Bought by
Hunter Donald D
Home Financials for this Owner
Home Financials are based on the most recent Mortgage that was taken out on this home.
Original Mortgage
$100,000
Outstanding Balance
$78,916
Interest Rate
4.13%
Mortgage Type
New Conventional
Estimated Equity
$327,863
Purchase Details
Closed on
Mar 29, 1994
Sold by
Wyscarver William G and Hall Sarah Lee Wyscarver
Bought by
Hunter Donald D and Winter Gloria L
Home Financials for this Owner
Home Financials are based on the most recent Mortgage that was taken out on this home.
Original Mortgage
$52,000
Interest Rate
7.05%
Create a Home Valuation Report for This Property
The Home Valuation Report is an in-depth analysis detailing your home's value as well as a comparison with similar homes in the area
Home Values in the Area
Average Home Value in this Area
Purchase History
| Date | Buyer | Sale Price | Title Company |
|---|---|---|---|
| Hunter Ean | $125,000 | First American | |
| Hunter Donald D | -- | First American | |
| Hunter Donald D | $59,000 | -- |
Source: Public Records
Mortgage History
| Date | Status | Borrower | Loan Amount |
|---|---|---|---|
| Open | Hunter Ean | $100,000 | |
| Previous Owner | Hunter Donald D | $52,000 |
Source: Public Records
Tax History Compared to Growth
Tax History
| Year | Tax Paid | Tax Assessment Tax Assessment Total Assessment is a certain percentage of the fair market value that is determined by local assessors to be the total taxable value of land and additions on the property. | Land | Improvement |
|---|---|---|---|---|
| 2024 | $2,085 | $26,320 | $8,540 | $17,780 |
| 2023 | $2,039 | $26,320 | $8,540 | $17,780 |
| 2022 | $1,837 | $23,100 | $12,680 | $10,420 |
| 2021 | $1,774 | $23,770 | $13,050 | $10,720 |
| 2020 | $1,515 | $20,420 | $7,590 | $12,830 |
| 2019 | $1,473 | $20,420 | $7,590 | $12,830 |
| 2018 | $1,239 | $16,010 | $5,730 | $10,280 |
| 2017 | $1,235 | $16,010 | $5,730 | $10,280 |
| 2016 | $949 | $11,640 | $4,752 | $6,888 |
| 2015 | $909 | $11,640 | $4,752 | $6,888 |
| 2014 | $653 | $7,860 | $2,643 | $5,217 |
Source: Public Records
Map
Nearby Homes
- 900 S Pecos Way
- 951 S Osage St
- 1158 S Navajo St
- 826 S Osage St
- 1221 S Quieto Way
- 735 S Peterson Way Unit 3
- 1448 W Ohio Ave
- 1125 S Raritan St
- 1224 S Mariposa St
- 892 S Shoshone St
- 1242 S Seneca Way
- 1150 S Taos Way
- 711 S Lipan St Unit 3
- 1395 W Exposition Ave
- 740 S Shoshone St
- 675 S Quivas St
- 2121 S Galapago St
- 1419 S Osage St
- 1163 S Umatilla St
- 1183 S Umatilla St
- 1571 W Hoye Place
- 1601 W Hoye Place
- 1551 W Hoye Place
- 1631 W Hoye Place
- 1582 W Hoye Place
- 1606 W Hoye Place
- 960 S Pecos Way
- 1531 W Hoye Place
- 1562 W Hoye Place
- 966 S Pecos Way
- 1542 W Hoye Place
- 1640 W Hoye Place
- 1651 W Hoye Place
- 1522 W Hoye Place
- 952 S Pecos Way
- 1501 W Hoye Place
- 974 S Pecos Way
- 1660 W Hoye Place
- 1671 W Hoye Place
- 982 S Pecos Way