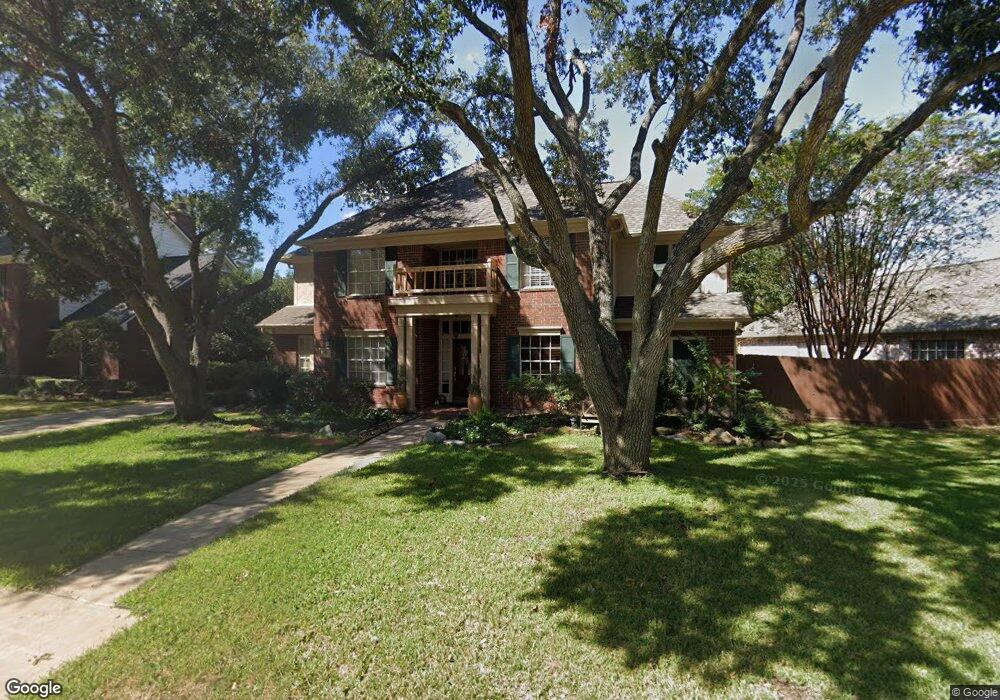
15910 Moonlight Creek Ct Houston, TX 77095
Copperfield NeighborhoodEstimated Value: $389,698 - $452,000
4
Beds
4
Baths
2,932
Sq Ft
$143/Sq Ft
Est. Value
About This Home
This home is located at 15910 Moonlight Creek Ct, Houston, TX 77095 and is currently estimated at $418,425, approximately $142 per square foot. 15910 Moonlight Creek Ct is a home located in Harris County with nearby schools including Lowery Elementary School, Aragon Middle School, and Langham Creek High School.
Ownership History
Date
Name
Owned For
Owner Type
Purchase Details
Closed on
Oct 9, 2015
Sold by
Baldwin W Charles and Baldwin Susan E
Bought by
Ramirez Jose C
Current Estimated Value
Home Financials for this Owner
Home Financials are based on the most recent Mortgage that was taken out on this home.
Original Mortgage
$137,000
Outstanding Balance
$107,973
Interest Rate
3.93%
Mortgage Type
New Conventional
Estimated Equity
$310,452
Purchase Details
Closed on
Mar 29, 1996
Sold by
Hembo Seth Leo and Hembo Kathy A
Bought by
Baldwin W Charles and Baldwin Susan E
Home Financials for this Owner
Home Financials are based on the most recent Mortgage that was taken out on this home.
Original Mortgage
$126,000
Interest Rate
6.92%
Create a Home Valuation Report for This Property
The Home Valuation Report is an in-depth analysis detailing your home's value as well as a comparison with similar homes in the area
Home Values in the Area
Average Home Value in this Area
Purchase History
| Date | Buyer | Sale Price | Title Company |
|---|---|---|---|
| Ramirez Jose C | -- | None Available | |
| Baldwin W Charles | -- | Houston Title |
Source: Public Records
Mortgage History
| Date | Status | Borrower | Loan Amount |
|---|---|---|---|
| Open | Ramirez Jose C | $137,000 | |
| Previous Owner | Baldwin W Charles | $126,000 |
Source: Public Records
Tax History Compared to Growth
Tax History
| Year | Tax Paid | Tax Assessment Tax Assessment Total Assessment is a certain percentage of the fair market value that is determined by local assessors to be the total taxable value of land and additions on the property. | Land | Improvement |
|---|---|---|---|---|
| 2025 | $4,928 | $326,000 | $82,555 | $243,445 |
| 2024 | $4,928 | $362,740 | $74,844 | $287,896 |
| 2023 | $4,928 | $364,217 | $74,844 | $289,373 |
| 2022 | $6,589 | $338,792 | $49,896 | $288,896 |
| 2021 | $6,313 | $267,853 | $49,896 | $217,957 |
| 2020 | $6,350 | $261,082 | $38,556 | $222,526 |
| 2019 | $6,316 | $251,310 | $35,381 | $215,929 |
| 2018 | $2,422 | $241,471 | $35,381 | $206,090 |
| 2017 | $6,094 | $241,471 | $35,381 | $206,090 |
| 2016 | $6,094 | $241,471 | $35,381 | $206,090 |
| 2015 | $4,268 | $232,184 | $35,381 | $196,803 |
| 2014 | $4,268 | $225,048 | $35,381 | $189,667 |
Source: Public Records
Map
Nearby Homes
- 15914 Waybridge Glen Ln
- 15726 Echo Lodge Dr
- 7403 Foxton Place Ct
- 7318 Starbridge Dr
- 7318 River Garden Dr
- 7419 Foxton Place Ct
- 7414 Starbridge Dr
- 7411 Marble Glen Ln
- 16023 Gladebrook Glen Ln
- 7054 River Garden Dr
- 7042 River Garden Dr
- 15810 Knoll Lake Dr
- 7511 Marble Glen Ln
- 16210 Summer Dew Ln
- 7411 Pacific Ridge Ct
- 7311 Postwick Ct
- 7415 Broken Ridge Dr
- 16331 Dew Drop Ln
- 16346 Pebbleglen Dr
- 7731 Club Lake Dr
- 15906 Moonlight Creek Ct
- 15917 Waybridge Glen Ln
- 15918 Moonlight Creek Ct
- 15921 Waybridge Glen Ln
- 15915 Moonlight Creek Ct
- 15911 Moonlight Creek Ct
- 15919 Moonlight Creek Ct
- 15907 Moonlight Creek Ct
- 15925 Waybridge Glen Ln
- 15906 Waybridge Glen Ln
- 15903 Moonlight Creek Ct
- 15910 Waybridge Glen Ln
- 15923 Moonlight Creek Ct
- 15922 Moonlight Creek Ct
- 15902 Waybridge Glen Ln
- 15814 Waybridge Glen Ln
- 7207 Palisades Heights Dr
- 7203 Palisades Heights Dr
- 7211 Palisades Heights Dr
- 15927 Moonlight Creek Ct