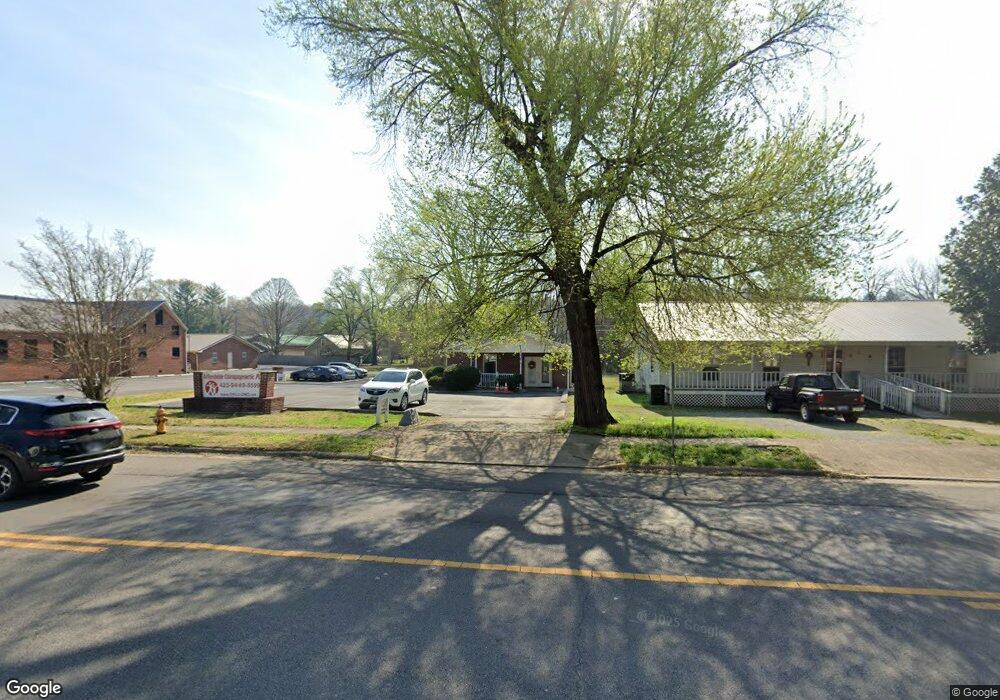
15912 Rankin Ave Dunlap, TN 37327
--
Bed
1
Bath
1,848
Sq Ft
0.28
Acres
About This Home
This home is located at 15912 Rankin Ave, Dunlap, TN 37327. 15912 Rankin Ave is a home located in Sequatchie County with nearby schools including Griffith Elementary School, Sequatchie County Middle School, and Sequatchie County High School.
Ownership History
Date
Name
Owned For
Owner Type
Purchase Details
Closed on
Oct 7, 2022
Sold by
Long Jamie R
Bought by
Long Monty C
Home Financials for this Owner
Home Financials are based on the most recent Mortgage that was taken out on this home.
Original Mortgage
$120,600
Outstanding Balance
$115,639
Interest Rate
5.89%
Mortgage Type
New Conventional
Purchase Details
Closed on
Jan 10, 2014
Sold by
First National Bank Of Pik
Bought by
Long Monty C and Long Jamie R
Home Financials for this Owner
Home Financials are based on the most recent Mortgage that was taken out on this home.
Original Mortgage
$166,600
Interest Rate
4.44%
Mortgage Type
Commercial
Purchase Details
Closed on
Jan 31, 2012
Sold by
Griswold Jane
Bought by
First National Bank Of Pikeville
Purchase Details
Closed on
May 12, 2008
Sold by
Bailey Mac Inc
Bought by
Jane Griswold
Home Financials for this Owner
Home Financials are based on the most recent Mortgage that was taken out on this home.
Original Mortgage
$240,400
Interest Rate
5.84%
Mortgage Type
Commercial
Purchase Details
Closed on
May 26, 2006
Bought by
Bailey Properties Inc
Create a Home Valuation Report for This Property
The Home Valuation Report is an in-depth analysis detailing your home's value as well as a comparison with similar homes in the area
Home Values in the Area
Average Home Value in this Area
Purchase History
| Date | Buyer | Sale Price | Title Company |
|---|---|---|---|
| Long Monty C | -- | -- | |
| Long Monty C | $170,000 | -- | |
| First National Bank Of Pikeville | $190,000 | -- | |
| Jane Griswold | $221,368 | -- | |
| Bailey Properties Inc | $190,000 | -- |
Source: Public Records
Mortgage History
| Date | Status | Borrower | Loan Amount |
|---|---|---|---|
| Open | Long Monty C | $120,600 | |
| Previous Owner | Long Monty C | $166,600 | |
| Previous Owner | Bailey Properties Inc | $240,400 |
Source: Public Records
Tax History Compared to Growth
Tax History
| Year | Tax Paid | Tax Assessment Tax Assessment Total Assessment is a certain percentage of the fair market value that is determined by local assessors to be the total taxable value of land and additions on the property. | Land | Improvement |
|---|---|---|---|---|
| 2025 | $2,296 | $95,080 | $0 | $0 |
| 2024 | $2,296 | $95,080 | $30,000 | $65,080 |
| 2023 | $2,296 | $95,080 | $30,000 | $65,080 |
| 2022 | $2,663 | $80,240 | $26,600 | $53,640 |
| 2021 | $2,623 | $80,240 | $26,600 | $53,640 |
| 2020 | $2,623 | $80,240 | $26,600 | $53,640 |
| 2019 | $2,623 | $80,240 | $26,600 | $53,640 |
| 2018 | $2,593 | $80,240 | $26,600 | $53,640 |
| 2017 | $2,563 | $80,240 | $26,600 | $53,640 |
| 2016 | $2,357 | $70,760 | $24,800 | $45,960 |
| 2015 | $2,357 | $70,760 | $24,800 | $45,960 |
| 2014 | $2,357 | $70,760 | $24,800 | $45,960 |
Source: Public Records
Map
Nearby Homes
- 0 State Rt 399 Lot 13
- 2 Fredonia Rd
- 1 Fredonia Rd
- 3 Fredonia Rd
- 103 Fredonia Rd
- 14999 Rankin Ave
- 0 SE US Hwy 127 Unit 1519993
- 0 SE US Hwy 127 Unit 1519990
- 0 SE US Hwy 127 Unit 1519988
- 0 SE US Hwy 127 Unit 1314389
- 0 SE US Hwy 127 Unit 1519979
- 0 SE US Hwy 127 Unit 1519991
- 0 SE US Hwy 127 Unit 1519984
- 21550 U S 127
- 410 Cherry St
- 254 Cdl Trail
- 95 Blue Sky Rd Rd
- Lot 13 B Greenfields Way
- 11342 Fredonia Rd
- 21 Fredonia Rd
- 15904 Rankin Ave
- 15922 Rankin Ave
- 1 Dell Trail
- 44 Alley St
- 15 Dell Trail
- 6897 Highway 28
- 0 Dell Trail
- 0 Dell Trail Unit 978202
- 0 Dell Trail Unit RTC2718839
- 0 Dell Trail Unit RTC2718828
- 0 Dell Trail Unit 1183108
- 15880 Rankin Ave
- 2 Dell Trail
- 15889 Rankin Ave
- 10 Dell Trail
- 27 Dell Trail
- 15959 Rankin Ave
- 15866 Rankin Ave
- 15875 Rankin Ave
- 44 St Clair Dr