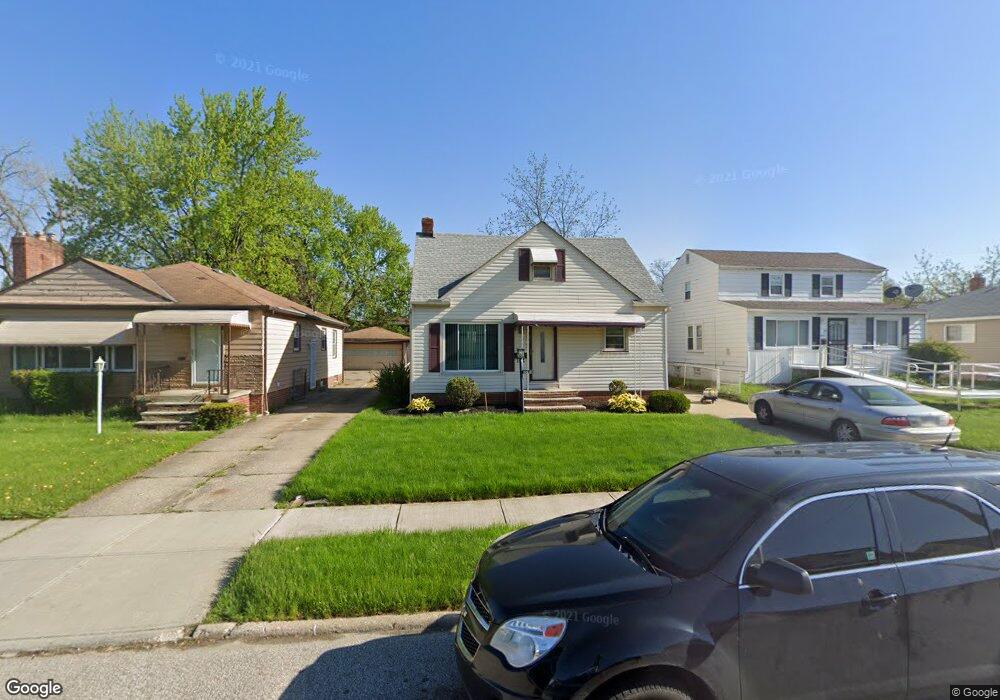
15913 Clearview Ave Cleveland, OH 44128
Lee-Miles NeighborhoodEstimated Value: $93,000 - $129,000
3
Beds
2
Baths
1,274
Sq Ft
$85/Sq Ft
Est. Value
About This Home
This home is located at 15913 Clearview Ave, Cleveland, OH 44128 and is currently estimated at $108,669, approximately $85 per square foot. 15913 Clearview Ave is a home located in Cuyahoga County with nearby schools including Adlai Stevenson School, Andrew J. Rickoff School, and Anton Grdina School.
Ownership History
Date
Name
Owned For
Owner Type
Purchase Details
Closed on
Nov 9, 2022
Sold by
Lewis Ronald and Lewis Reba
Bought by
Lewis Ronald and Smith-Lewis Reba
Current Estimated Value
Home Financials for this Owner
Home Financials are based on the most recent Mortgage that was taken out on this home.
Original Mortgage
$80,000
Outstanding Balance
$75,858
Interest Rate
4%
Mortgage Type
VA
Estimated Equity
$32,811
Purchase Details
Closed on
Jun 3, 1999
Sold by
Fuller Viola
Bought by
Lewis Ronald
Home Financials for this Owner
Home Financials are based on the most recent Mortgage that was taken out on this home.
Original Mortgage
$74,961
Interest Rate
7.61%
Mortgage Type
FHA
Purchase Details
Closed on
Jun 6, 1997
Sold by
Ball Labertha
Bought by
Fuller Viola
Purchase Details
Closed on
Oct 1, 1986
Sold by
Ball Arthur and Ball L
Bought by
Ball Labertha
Purchase Details
Closed on
Jan 1, 1975
Bought by
Ball Arthur and Ball L
Create a Home Valuation Report for This Property
The Home Valuation Report is an in-depth analysis detailing your home's value as well as a comparison with similar homes in the area
Home Values in the Area
Average Home Value in this Area
Purchase History
| Date | Buyer | Sale Price | Title Company |
|---|---|---|---|
| Lewis Ronald | -- | -- | |
| Lewis Ronald | $75,000 | Midland Title Security Inc | |
| Fuller Viola | $24,600 | -- | |
| Ball Labertha | -- | -- | |
| Ball Arthur | -- | -- |
Source: Public Records
Mortgage History
| Date | Status | Borrower | Loan Amount |
|---|---|---|---|
| Open | Lewis Ronald | $80,000 | |
| Previous Owner | Lewis Ronald | $74,961 |
Source: Public Records
Tax History Compared to Growth
Tax History
| Year | Tax Paid | Tax Assessment Tax Assessment Total Assessment is a certain percentage of the fair market value that is determined by local assessors to be the total taxable value of land and additions on the property. | Land | Improvement |
|---|---|---|---|---|
| 2024 | $2,029 | $30,345 | $5,215 | $25,130 |
| 2023 | $980 | $12,640 | $3,750 | $8,890 |
| 2022 | $974 | $12,640 | $3,750 | $8,890 |
| 2021 | $965 | $12,640 | $3,750 | $8,890 |
| 2020 | $1,002 | $11,340 | $3,430 | $7,910 |
| 2019 | $928 | $32,400 | $9,800 | $22,600 |
| 2018 | $1,012 | $11,340 | $3,430 | $7,910 |
| 2017 | $1,108 | $13,100 | $3,260 | $9,840 |
| 2016 | $1,099 | $13,100 | $3,260 | $9,840 |
| 2015 | $1,227 | $13,100 | $3,260 | $9,840 |
| 2014 | $1,227 | $14,570 | $3,610 | $10,960 |
Source: Public Records
Map
Nearby Homes
- 15909 Bryce Ave
- 16309 Bryce Ave
- 16317 Clearview Ave
- 16401 Clearview Ave
- 16322 Tarkington Ave
- 4562 Lee Rd
- 16613 Glenpark Ave
- 16702 Tarkington Ave
- 16312 Sunny Glenn Ave
- 4461 E 158th St
- 4468 E 156th St
- 15009 Lawndale Ave
- 4445 E 154th St
- 16813 Lipton Ave
- 4440 E 154th St
- 4425 E 154th St
- 14817 Naples Ave
- 16205 Kollin Ave
- 17005 Lipton Ave
- 16224 Kollin Ave
- 15909 Clearview Ave
- 16001 Clearview Ave
- 16005 Clearview Ave
- 15914 Bryce Ave
- 15903 Clearview Ave
- 16009 Clearview Ave
- 16002 Bryce Ave
- 15910 Bryce Ave
- 16006 Bryce Ave
- 16101 Clearview Ave
- 15902 Bryce Ave
- 15914 Clearview Ave
- 16010 Bryce Ave
- 15910 Clearview Ave
- 16002 Clearview Ave
- 15906 Clearview Ave
- 16004 Clearview Ave
- 16102 Bryce Ave
- 15902 Clearview Ave
- 16010 Clearview Ave