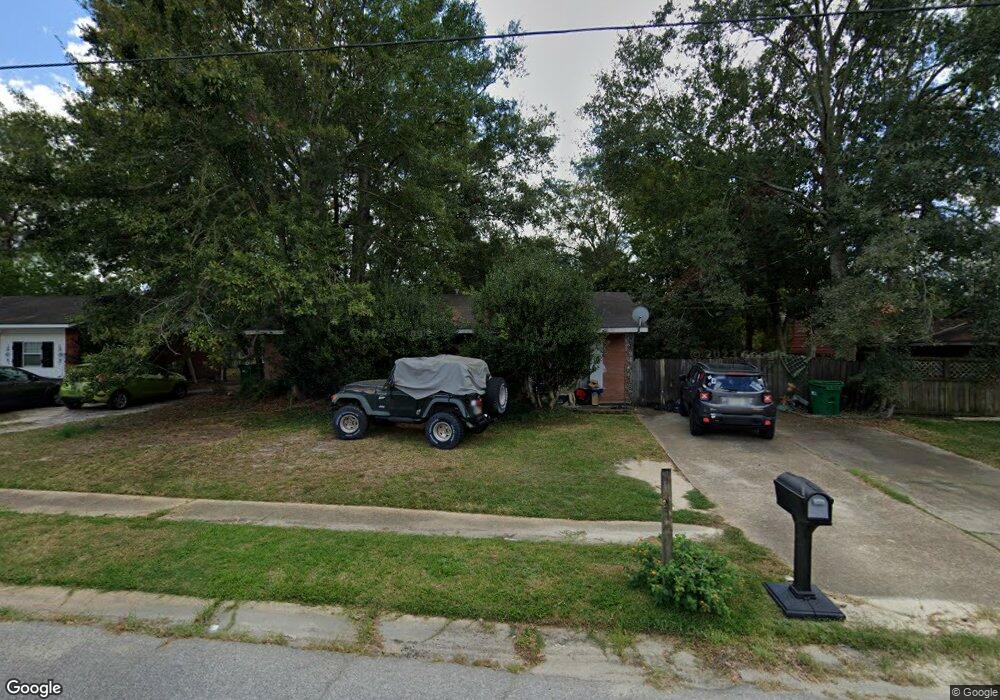
15913 Waycross Dr Biloxi, MS 39532
Estimated Value: $122,405 - $169,000
--
Bed
1
Bath
1,372
Sq Ft
$110/Sq Ft
Est. Value
About This Home
This home is located at 15913 Waycross Dr, Biloxi, MS 39532 and is currently estimated at $151,101, approximately $110 per square foot. 15913 Waycross Dr is a home located in Jackson County with nearby schools including St Martin North Elementary School, St Martin East Elementary School, and St Martin Upper Elementary School.
Create a Home Valuation Report for This Property
The Home Valuation Report is an in-depth analysis detailing your home's value as well as a comparison with similar homes in the area
Home Values in the Area
Average Home Value in this Area
Tax History Compared to Growth
Tax History
| Year | Tax Paid | Tax Assessment Tax Assessment Total Assessment is a certain percentage of the fair market value that is determined by local assessors to be the total taxable value of land and additions on the property. | Land | Improvement |
|---|---|---|---|---|
| 2024 | $1,253 | $10,281 | $2,184 | $8,097 |
| 2023 | $1,253 | $10,281 | $2,184 | $8,097 |
| 2022 | $1,219 | $10,281 | $2,184 | $8,097 |
| 2021 | $1,230 | $10,370 | $2,184 | $8,186 |
| 2020 | $1,058 | $8,586 | $2,184 | $6,402 |
| 2019 | $1,047 | $8,586 | $2,184 | $6,402 |
| 2018 | $1,067 | $8,586 | $2,184 | $6,402 |
| 2017 | $1,084 | $8,586 | $2,184 | $6,402 |
| 2016 | $1,042 | $8,586 | $2,184 | $6,402 |
| 2015 | $942 | $51,430 | $14,560 | $36,870 |
| 2014 | $926 | $7,715 | $2,184 | $5,531 |
| 2013 | $896 | $7,715 | $2,184 | $5,531 |
Source: Public Records
Map
Nearby Homes
- 15905 Waycross Dr
- 15917 Big Ridge Rd
- 7646 Madison Dr
- 16205 Waycross Dr
- 7650 Lexington Dr
- 16301 Trenton Dr
- 7400 Kentwood Dr
- 7112 Melon Dr
- 15601 Big Ridge Rd
- 7204 Hampton Dr
- 16029 Cherry Dr
- 3040 Highland Ave
- 0 Quail Unit 4134346
- 15520 Lyda Steen Dr
- 15600 Glen Dr
- 0 W Diane Dr Unit 4120993
- 15217 Lawton Dr
- 7116 Knollwood Dr
- 15505 Prairie St
- 6611 Omaha St
- 15917 Waycross Dr
- 15909 Waycross Dr
- 7501 Portland Dr
- 15945 Albany Dr
- 15945 Albany Dr Dr Unit 1
- 15945 Albany Dr Dr
- 7500 Portland Dr
- 15949 Albany Dr
- 15921 Waycross Dr
- 15901 Waycross Dr
- 15941 Albany Dr
- 7505 Portland Dr
- 15953 Albany Dr
- 7501 Macon Ave
- 7504 Portland Dr
- 15925 Waycross Dr
- 16000 Franklin Dr
- 7509 Portland Dr
- 15957 Albany Dr
- 7505 Macon Ave