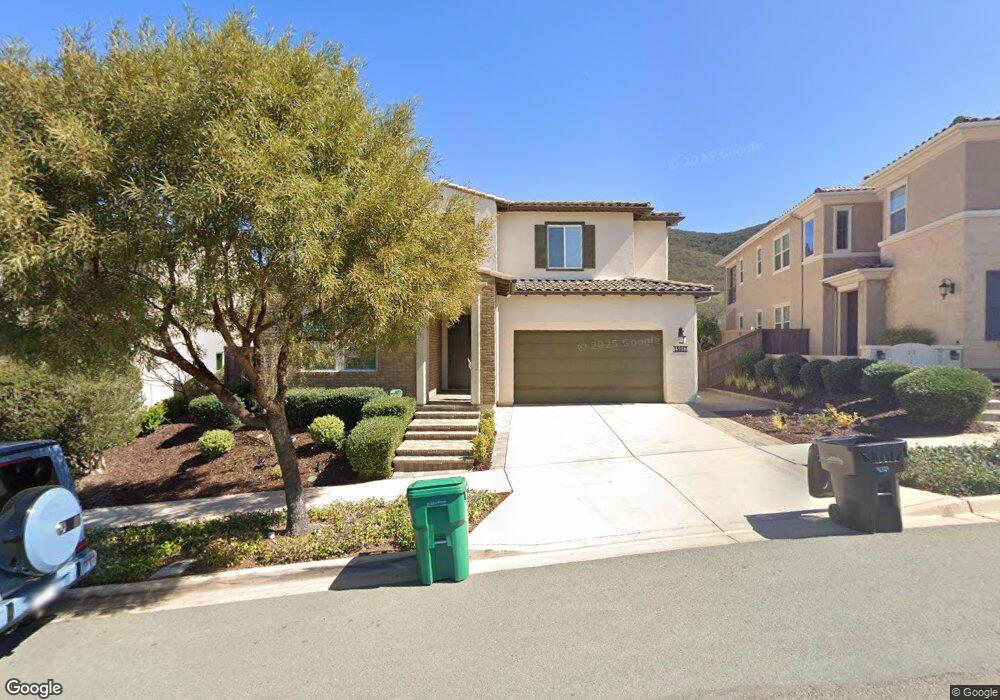
15913 Winecreek Dr San Diego, CA 92127
Rancho Peñasquitos NeighborhoodEstimated Value: $2,297,494 - $2,646,000
4
Beds
3
Baths
3,030
Sq Ft
$813/Sq Ft
Est. Value
About This Home
This home is located at 15913 Winecreek Dr, San Diego, CA 92127 and is currently estimated at $2,464,624, approximately $813 per square foot. 15913 Winecreek Dr is a home with nearby schools including Willow Grove Elementary School, Oak Valley Middle, and Del Norte High School.
Ownership History
Date
Name
Owned For
Owner Type
Purchase Details
Closed on
Mar 15, 2023
Sold by
Mohip Rajesh
Bought by
Rampari Trust
Current Estimated Value
Purchase Details
Closed on
Jun 19, 2020
Sold by
Gupta Rajani K and Rampari Trust
Bought by
Mohip Rajesh and Gupta Rita
Home Financials for this Owner
Home Financials are based on the most recent Mortgage that was taken out on this home.
Original Mortgage
$768,200
Interest Rate
2.8%
Mortgage Type
New Conventional
Purchase Details
Closed on
Oct 23, 2018
Sold by
Mohip Rajesh and Gupta Rita
Bought by
Gupta Rajani K
Purchase Details
Closed on
Feb 8, 2018
Sold by
Spic Del Sur Llc
Bought by
Mohip Rajesh and Gupta Rita
Home Financials for this Owner
Home Financials are based on the most recent Mortgage that was taken out on this home.
Original Mortgage
$803,000
Interest Rate
3.99%
Mortgage Type
New Conventional
Create a Home Valuation Report for This Property
The Home Valuation Report is an in-depth analysis detailing your home's value as well as a comparison with similar homes in the area
Home Values in the Area
Average Home Value in this Area
Purchase History
| Date | Buyer | Sale Price | Title Company |
|---|---|---|---|
| Rampari Trust | -- | -- | |
| Mohip Rajesh | -- | Amrock Inc | |
| Gupta Rajani K | -- | None Available | |
| Mohip Rajesh | -- | None Available | |
| Mohip Rajesh | $1,236,000 | First American Title Hsd |
Source: Public Records
Mortgage History
| Date | Status | Borrower | Loan Amount |
|---|---|---|---|
| Previous Owner | Mohip Rajesh | $768,200 | |
| Previous Owner | Mohip Rajesh | $803,000 |
Source: Public Records
Tax History Compared to Growth
Tax History
| Year | Tax Paid | Tax Assessment Tax Assessment Total Assessment is a certain percentage of the fair market value that is determined by local assessors to be the total taxable value of land and additions on the property. | Land | Improvement |
|---|---|---|---|---|
| 2025 | $24,408 | $1,406,140 | $682,696 | $723,444 |
| 2024 | $24,408 | $1,378,569 | $669,310 | $709,259 |
| 2023 | $23,960 | $1,351,539 | $656,187 | $695,352 |
| 2022 | $23,620 | $1,325,039 | $643,321 | $681,718 |
| 2021 | $23,084 | $1,299,058 | $630,707 | $668,351 |
| 2020 | $22,750 | $1,285,738 | $624,240 | $661,498 |
| 2019 | $22,084 | $1,260,528 | $612,000 | $648,528 |
| 2018 | $16,027 | $741,139 | $171,139 | $570,000 |
Source: Public Records
Map
Nearby Homes
- 11183 Linares St
- 11048 Carlota St
- 15020 Penasquitos Dr
- 11384 Almazon St
- 0 Madrigal St Unit 144
- 14793 Penasquitos Dr
- 15985 Camino Crisalida Unit 5
- 11225 Madrigal St
- 15610 Corte Raposo
- 15589 Paseo Jenghiz
- 15541 Paseo Jenghiz
- 16115 Palomino Valley Ct
- 11378 Ajanta Ct
- Residence 2 Plan at Junipers - Sycamore
- at Junipers - Lilac
- Residence 3X Plan at Junipers - Lilac
- Residence 2 Plan at Junipers - Woodlands
- Residence 3 Plan at Junipers - Woodlands
- Residence 2X Plan at Junipers - Lilac
- Residence 2 Plan at Junipers - Lilac
- 15917 Winecreek Dr
- 15909 Winecreek Dr
- 15921 Winecreek Dr
- 15905 Winecreek Dr
- 15915 Pomerol Ln
- 15925 Winecreek Dr
- 15901 Winecreek Dr
- 15911 Pomerol Ln
- 15929 Winecreek Dr
- 15907 Pomerol Ln
- 15897 Winecreek Dr
- 15916 Pomerol Ln
- 15890 Winecreek Dr
- 15933 Winecreek Dr
- 15910 Pomerol Ln
- 15903 Pomerol Ln
- 15893 Winecreek Dr
- 15906 Pomerol Ln
- 15886 Winecreek Dr
- 15917 Sarah Ridge Rd