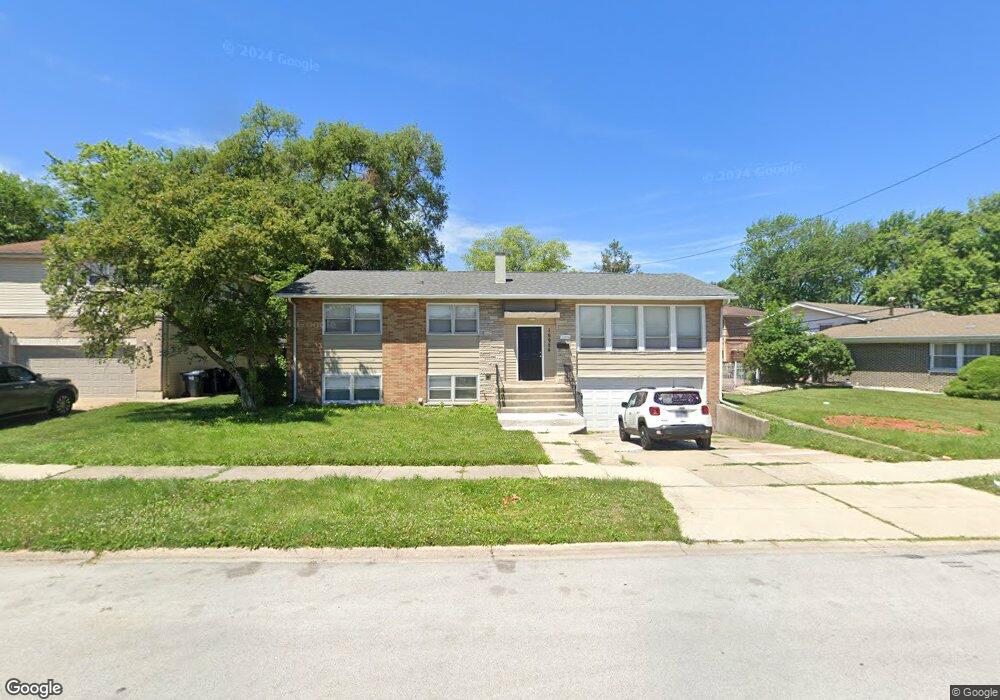
15924 Minerva Ave South Holland, IL 60473
South River-Cook County NeighborhoodEstimated Value: $208,000 - $277,000
4
Beds
2
Baths
1,397
Sq Ft
$169/Sq Ft
Est. Value
About This Home
This home is located at 15924 Minerva Ave, South Holland, IL 60473 and is currently estimated at $236,459, approximately $169 per square foot. 15924 Minerva Ave is a home located in Cook County with nearby schools including Taft School, Eisenhower School, and Coolidge Middle School.
Ownership History
Date
Name
Owned For
Owner Type
Purchase Details
Closed on
Jul 28, 2015
Sold by
Bltrejv3 Chicago Llc
Bought by
Csma Blt Llc
Current Estimated Value
Purchase Details
Closed on
Nov 26, 2013
Sold by
Nana Emmanuel O
Bought by
Bltrejv3 Chicago Llc
Purchase Details
Closed on
Oct 12, 2005
Sold by
Abbey Tiyabatu Ibrahim
Bought by
Nana Emmanuel O
Purchase Details
Closed on
Apr 30, 2004
Sold by
Oyefeso Adebowale A
Bought by
Great Lakes Trust Co Na and Trust #04028
Purchase Details
Closed on
Feb 13, 2004
Sold by
Nana Emmanuel O
Bought by
Abbey Tiyabatu Ibrahim
Purchase Details
Closed on
Oct 28, 1997
Sold by
South Holland Trust & Svgs Bank
Bought by
Nana Emmanuel O
Home Financials for this Owner
Home Financials are based on the most recent Mortgage that was taken out on this home.
Original Mortgage
$87,750
Interest Rate
9.5%
Create a Home Valuation Report for This Property
The Home Valuation Report is an in-depth analysis detailing your home's value as well as a comparison with similar homes in the area
Home Values in the Area
Average Home Value in this Area
Purchase History
| Date | Buyer | Sale Price | Title Company |
|---|---|---|---|
| Csma Blt Llc | $953,500 | Attorney | |
| Bltrejv3 Chicago Llc | $74,500 | None Available | |
| Nana Emmanuel O | -- | None Available | |
| Great Lakes Trust Co Na | -- | -- | |
| Abbey Tiyabatu Ibrahim | -- | -- | |
| Nana Emmanuel O | $117,000 | -- |
Source: Public Records
Mortgage History
| Date | Status | Borrower | Loan Amount |
|---|---|---|---|
| Previous Owner | Nana Emmanuel O | $87,750 |
Source: Public Records
Tax History Compared to Growth
Tax History
| Year | Tax Paid | Tax Assessment Tax Assessment Total Assessment is a certain percentage of the fair market value that is determined by local assessors to be the total taxable value of land and additions on the property. | Land | Improvement |
|---|---|---|---|---|
| 2024 | $9,423 | $20,186 | $4,539 | $15,647 |
| 2023 | $7,857 | $20,186 | $4,539 | $15,647 |
| 2022 | $7,857 | $13,107 | $3,890 | $9,217 |
| 2021 | $7,770 | $13,107 | $3,890 | $9,217 |
| 2020 | $7,319 | $13,107 | $3,890 | $9,217 |
| 2019 | $6,879 | $11,781 | $3,458 | $8,323 |
| 2018 | $6,719 | $11,781 | $3,458 | $8,323 |
| 2017 | $6,526 | $11,781 | $3,458 | $8,323 |
| 2016 | $5,727 | $10,559 | $3,241 | $7,318 |
| 2015 | $5,553 | $10,559 | $3,241 | $7,318 |
| 2014 | $5,432 | $10,559 | $3,241 | $7,318 |
| 2013 | $5,861 | $12,082 | $3,241 | $8,841 |
Source: Public Records
Map
Nearby Homes
- 1047 Riverview Dr
- 1012 E 159th Place
- 1142 E 159th Place
- 1144 E 160th Place
- 1161 E 158th St
- 16030 University Ave
- 15966 Debbie Ln
- 16006 Avalon Ave
- 15739 Ingleside Ave
- 16001 Avalon Ave
- 16053 University Ave
- 15726 Avalon Ave
- 15666 Woodlawn East Ave
- 16015 Drexel Ave
- 15701 Drexel Ave
- 16007 Cottage Grove Ave
- 15620 Ingleside Ave
- 1354 E 158th St
- 15630 Drexel Ave
- 15530 University Ave
- 15916 Minerva Ave
- 1045 E 159th Place
- 15940 Minerva Ave
- 15931 Dobson Ave
- 15937 Dobson Ave
- 1029 E 159th Place
- 1115 E 159th Place
- 15946 Minerva Ave
- 15947 Dobson Ave
- 1054 E 159th Place
- 1121 E 159th Place
- 1048 E 159th Place
- 1058 E 159th Place
- 15954 Minerva Ave
- 1042 E 159th Place
- 1100 E 159th Place
- 15951 Dobson Ave
- 1036 E 159th Place
- 1106 E 159th Place