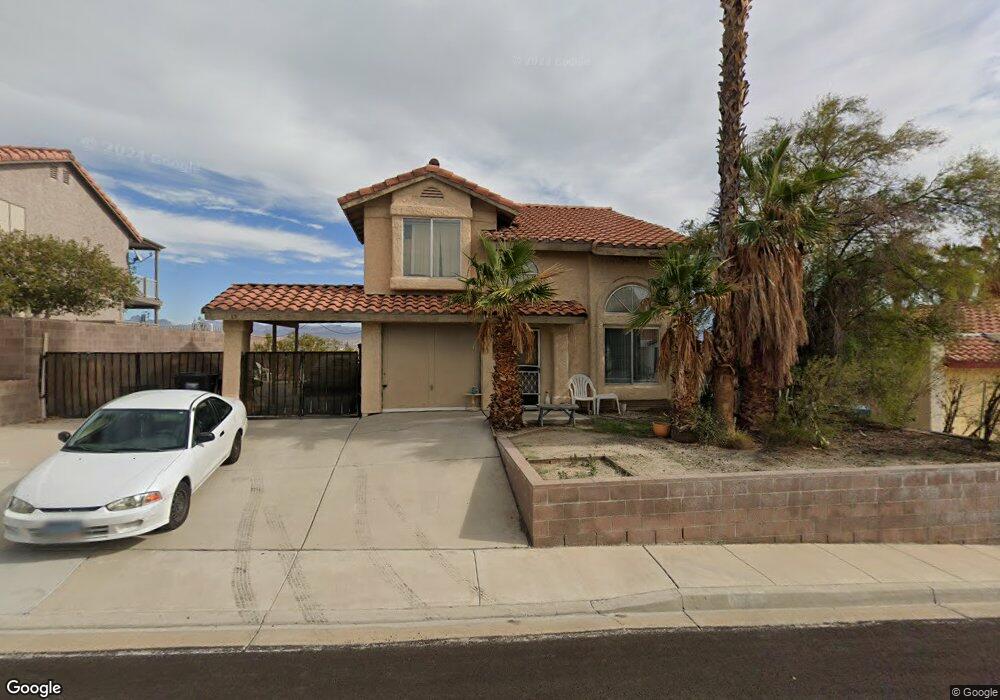
1593 Paloma Ave Laughlin, NV 89029
Estimated Value: $260,000 - $299,000
3
Beds
3
Baths
1,369
Sq Ft
$203/Sq Ft
Est. Value
About This Home
This home is located at 1593 Paloma Ave, Laughlin, NV 89029 and is currently estimated at $278,412, approximately $203 per square foot. 1593 Paloma Ave is a home located in Clark County with nearby schools including William G. Bennett Elementary School and Laughlin Junior/Senior High School.
Ownership History
Date
Name
Owned For
Owner Type
Purchase Details
Closed on
Feb 1, 2008
Sold by
Washington Mutual Bank
Bought by
Cutright Andrew J and Cutright Gloria
Current Estimated Value
Home Financials for this Owner
Home Financials are based on the most recent Mortgage that was taken out on this home.
Original Mortgage
$156,655
Outstanding Balance
$96,622
Interest Rate
5.64%
Mortgage Type
Unknown
Estimated Equity
$181,790
Purchase Details
Closed on
Sep 20, 2007
Sold by
Garcia Esperanza Padilla
Bought by
Washington Mutual Bank
Purchase Details
Closed on
Jan 2, 1998
Sold by
Padilla Esperanza
Bought by
Padilla Garcia Esperanza
Home Financials for this Owner
Home Financials are based on the most recent Mortgage that was taken out on this home.
Original Mortgage
$3,000
Interest Rate
7.22%
Purchase Details
Closed on
Dec 17, 1997
Sold by
Bontrager Lorraine
Bought by
Padilla Esperanza
Home Financials for this Owner
Home Financials are based on the most recent Mortgage that was taken out on this home.
Original Mortgage
$3,000
Interest Rate
7.22%
Create a Home Valuation Report for This Property
The Home Valuation Report is an in-depth analysis detailing your home's value as well as a comparison with similar homes in the area
Home Values in the Area
Average Home Value in this Area
Purchase History
| Date | Buyer | Sale Price | Title Company |
|---|---|---|---|
| Cutright Andrew J | $164,900 | Service Link | |
| Washington Mutual Bank | $171,000 | Fidelity National Title | |
| Padilla Garcia Esperanza | -- | -- | |
| Padilla Esperanza | $12,000 | Nevada Title Company |
Source: Public Records
Mortgage History
| Date | Status | Borrower | Loan Amount |
|---|---|---|---|
| Open | Cutright Andrew J | $156,655 | |
| Previous Owner | Padilla Esperanza | $3,000 |
Source: Public Records
Tax History Compared to Growth
Tax History
| Year | Tax Paid | Tax Assessment Tax Assessment Total Assessment is a certain percentage of the fair market value that is determined by local assessors to be the total taxable value of land and additions on the property. | Land | Improvement |
|---|---|---|---|---|
| 2025 | $1,797 | $45,154 | $13,300 | $31,854 |
| 2024 | $1,678 | $45,154 | $13,300 | $31,854 |
| 2023 | $1,678 | $50,587 | $19,600 | $30,987 |
| 2022 | $1,568 | $44,353 | $15,750 | $28,603 |
| 2021 | $1,717 | $41,186 | $13,650 | $27,536 |
| 2020 | $1,106 | $41,267 | $13,650 | $27,617 |
| 2019 | $1,036 | $39,008 | $11,550 | $27,458 |
| 2018 | $989 | $37,698 | $11,200 | $26,498 |
| 2017 | $1,266 | $37,802 | $10,850 | $26,952 |
| 2016 | $1,177 | $34,509 | $7,000 | $27,509 |
| 2015 | $1,175 | $30,951 | $5,250 | $25,701 |
| 2014 | $1,147 | $25,936 | $5,250 | $20,686 |
Source: Public Records
Map
Nearby Homes
- 1671 Granada St
- 3008 Soledad Dr
- 3249 Del Monte St
- 3262 Del Monte St
- 3252 Calanda St
- 3253 Calanda St
- 3280 Del Monte St
- 1671 Esquina St
- 1826 Dunes Ct
- 2822 La Palma Dr
- 1851 Maricopa Dr
- 1862 Maricopa Dr
- 2012 Mesquite Ln Unit 304
- 2823 Biscaya Dr
- 2016 Mesquite Ln Unit 104
- 2016 Mesquite Ln Unit 302
- 3550 Bay Sands Dr Unit 3049
- 2028 Mesquite Ln Unit 302
- 3550 Bay Sands Dr Unit 2048
- 3550 Bay Sands Dr Unit 2076
- 1591 Paloma Ave
- 1595 Paloma Ave
- 1589 Paloma Ave
- 1597 Paloma Ave
- 1594 Paloma Ave
- 1592 Paloma Ave
- 1596 Paloma Ave
- 1590 Paloma Ave
- 1587 Paloma Ave
- 1599 Paloma Ave
- 1598 Paloma Ave
- 1588 Paloma Ave
- 1600 Paloma Ave
- 3050 Leandro Ct
- 3038 Leandro Ct
- 3062 Leandro Ct
- 1585 Paloma Ave
- 3026 Leandro Ct
- 3074 Leandro Ct
- 1604 Paloma Ave