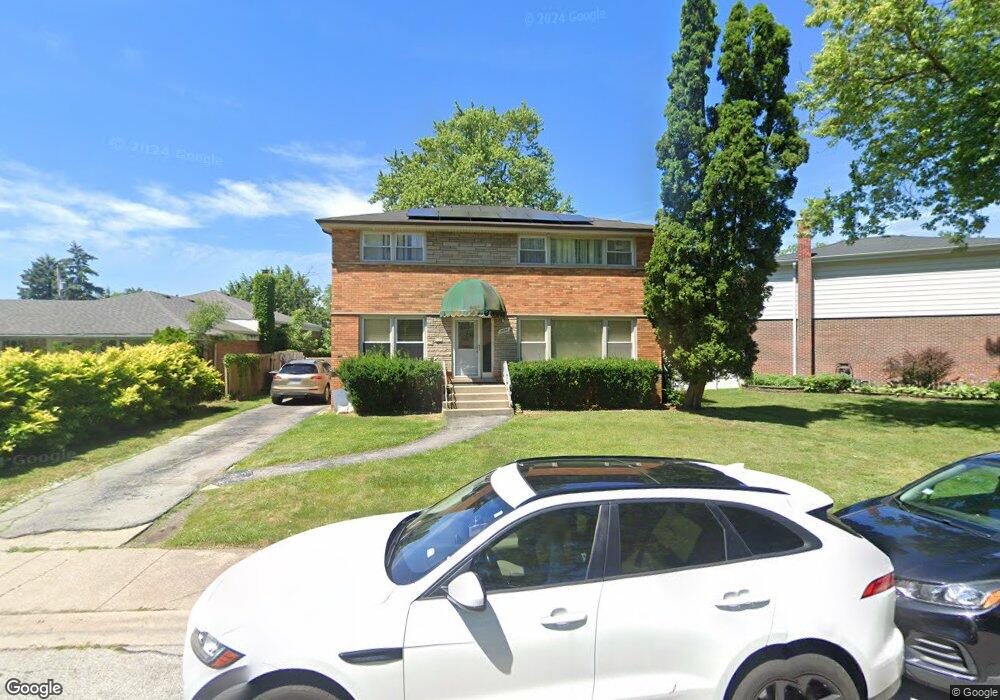
15934 Dobson Ave South Holland, IL 60473
South River-Cook County NeighborhoodEstimated Value: $271,000 - $309,000
5
Beds
2
Baths
1,930
Sq Ft
$148/Sq Ft
Est. Value
About This Home
This home is located at 15934 Dobson Ave, South Holland, IL 60473 and is currently estimated at $286,273, approximately $148 per square foot. 15934 Dobson Ave is a home located in Cook County with nearby schools including Taft School, Eisenhower School, and Coolidge Middle School.
Ownership History
Date
Name
Owned For
Owner Type
Purchase Details
Closed on
Jul 15, 2005
Sold by
Branch Alverto T
Bought by
Tsagli Foster
Current Estimated Value
Home Financials for this Owner
Home Financials are based on the most recent Mortgage that was taken out on this home.
Original Mortgage
$199,500
Outstanding Balance
$119,019
Interest Rate
7.95%
Mortgage Type
Stand Alone First
Estimated Equity
$167,254
Purchase Details
Closed on
Nov 25, 2002
Sold by
Branch Glenn E and Branch Alverto T
Bought by
Branch Alverto T
Home Financials for this Owner
Home Financials are based on the most recent Mortgage that was taken out on this home.
Original Mortgage
$89,000
Interest Rate
6.25%
Purchase Details
Closed on
Nov 5, 1993
Sold by
Dwornik Frank C and Dwornik Dorothy T
Bought by
Branch Glenn E and Branch Alverto T
Home Financials for this Owner
Home Financials are based on the most recent Mortgage that was taken out on this home.
Original Mortgage
$96,850
Interest Rate
6.96%
Mortgage Type
FHA
Create a Home Valuation Report for This Property
The Home Valuation Report is an in-depth analysis detailing your home's value as well as a comparison with similar homes in the area
Home Values in the Area
Average Home Value in this Area
Purchase History
| Date | Buyer | Sale Price | Title Company |
|---|---|---|---|
| Tsagli Foster | $210,000 | Ticor Title | |
| Branch Alverto T | -- | Lawyers Title Insurance Corp | |
| Branch Glenn E | $64,666 | -- |
Source: Public Records
Mortgage History
| Date | Status | Borrower | Loan Amount |
|---|---|---|---|
| Open | Tsagli Foster | $199,500 | |
| Previous Owner | Branch Alverto T | $89,000 | |
| Previous Owner | Branch Glenn E | $96,850 |
Source: Public Records
Tax History Compared to Growth
Tax History
| Year | Tax Paid | Tax Assessment Tax Assessment Total Assessment is a certain percentage of the fair market value that is determined by local assessors to be the total taxable value of land and additions on the property. | Land | Improvement |
|---|---|---|---|---|
| 2024 | $10,123 | $25,000 | $3,755 | $21,245 |
| 2023 | $6,088 | $25,000 | $3,755 | $21,245 |
| 2022 | $6,088 | $13,578 | $3,219 | $10,359 |
| 2021 | $6,075 | $13,577 | $3,218 | $10,359 |
| 2020 | $5,849 | $13,577 | $3,218 | $10,359 |
| 2019 | $5,303 | $12,511 | $2,861 | $9,650 |
| 2018 | $5,176 | $12,511 | $2,861 | $9,650 |
| 2017 | $5,061 | $12,511 | $2,861 | $9,650 |
| 2016 | $4,445 | $10,692 | $2,682 | $8,010 |
| 2015 | $4,243 | $10,692 | $2,682 | $8,010 |
| 2014 | $5,178 | $12,633 | $2,682 | $9,951 |
| 2013 | $4,997 | $12,930 | $2,682 | $10,248 |
Source: Public Records
Map
Nearby Homes
- 1012 E 159th Place
- 1047 Riverview Dr
- 15966 Debbie Ln
- 16030 University Ave
- 1144 E 160th Place
- 1142 E 159th Place
- 16015 Drexel Ave
- 15739 Ingleside Ave
- 16053 University Ave
- 16006 Avalon Ave
- 16007 Cottage Grove Ave
- 16001 Avalon Ave
- 1161 E 158th St
- 15701 Drexel Ave
- 15726 Avalon Ave
- 15666 Woodlawn East Ave
- 16037 Evans Ave
- 1012 E 162nd Place
- 15620 Ingleside Ave
- 907 E 162nd Place
- 15938 Dobson Ave
- 15928 Dobson Ave
- 1011 E 159th Place
- 15946 Dobson Ave
- 15939 Ellis Ave
- 15933 Ellis Ave
- 15954 Dobson Ave
- 15931 Dobson Ave
- 15937 Dobson Ave
- 15955 Ellis Ave
- 1029 E 159th Place
- 15960 Dobson Ave
- 15947 Dobson Ave
- 1018 E 159th Place
- 1024 E 159th Place
- 15961 Ellis Ave
- 1030 E 159th Place
- 15951 Dobson Ave
- 1006 E 159th Place
- 15966 Dobson Ave