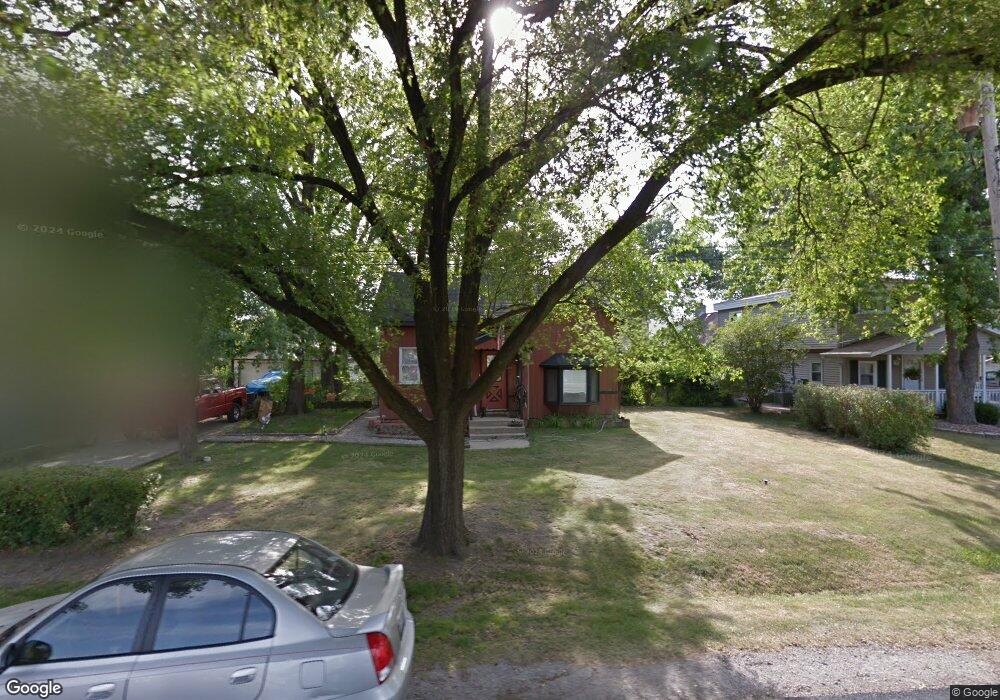
15936 Latrobe Ave Oak Forest, IL 60452
Estimated Value: $186,086 - $233,000
3
Beds
1
Bath
710
Sq Ft
$298/Sq Ft
Est. Value
About This Home
This home is located at 15936 Latrobe Ave, Oak Forest, IL 60452 and is currently estimated at $211,772, approximately $298 per square foot. 15936 Latrobe Ave is a home located in Cook County with nearby schools including Kimberly Heights Elementary School, Scarlet Oak Elementary School, and Arbor Park Middle School.
Ownership History
Date
Name
Owned For
Owner Type
Purchase Details
Closed on
Jan 23, 2008
Sold by
Hud
Bought by
Pluska Casimir M
Current Estimated Value
Home Financials for this Owner
Home Financials are based on the most recent Mortgage that was taken out on this home.
Original Mortgage
$145,000
Outstanding Balance
$88,381
Interest Rate
5.51%
Mortgage Type
Unknown
Estimated Equity
$123,391
Purchase Details
Closed on
Dec 12, 2006
Sold by
Kaminski Ricky E
Bought by
Hud
Purchase Details
Closed on
Mar 24, 2000
Sold by
Schultz Valerie J
Bought by
Kaminski Ricky E
Home Financials for this Owner
Home Financials are based on the most recent Mortgage that was taken out on this home.
Original Mortgage
$117,419
Interest Rate
8.39%
Purchase Details
Closed on
Jul 15, 1999
Sold by
Schultz Kenneth A
Bought by
Schultz Valerie
Create a Home Valuation Report for This Property
The Home Valuation Report is an in-depth analysis detailing your home's value as well as a comparison with similar homes in the area
Home Values in the Area
Average Home Value in this Area
Purchase History
| Date | Buyer | Sale Price | Title Company |
|---|---|---|---|
| Pluska Casimir M | -- | Stewart Title Of Illinois | |
| Hud | -- | None Available | |
| Kaminski Ricky E | $119,000 | -- | |
| Schultz Valerie | -- | -- |
Source: Public Records
Mortgage History
| Date | Status | Borrower | Loan Amount |
|---|---|---|---|
| Open | Pluska Casimir M | $145,000 | |
| Previous Owner | Kaminski Ricky E | $117,419 |
Source: Public Records
Tax History Compared to Growth
Tax History
| Year | Tax Paid | Tax Assessment Tax Assessment Total Assessment is a certain percentage of the fair market value that is determined by local assessors to be the total taxable value of land and additions on the property. | Land | Improvement |
|---|---|---|---|---|
| 2024 | $2,543 | $13,000 | $5,940 | $7,060 |
| 2023 | -- | $13,000 | $5,940 | $7,060 |
| 2022 | $0 | $15,000 | $5,280 | $9,720 |
| 2021 | $5,211 | $14,999 | $5,280 | $9,719 |
| 2020 | $5,211 | $14,999 | $5,280 | $9,719 |
| 2019 | $4,382 | $13,195 | $4,950 | $8,245 |
| 2018 | $0 | $13,195 | $4,950 | $8,245 |
| 2017 | $0 | $13,195 | $4,950 | $8,245 |
| 2016 | $0 | $11,412 | $4,620 | $6,792 |
| 2015 | $0 | $11,412 | $4,620 | $6,792 |
| 2014 | $3,802 | $11,412 | $4,620 | $6,792 |
| 2013 | $3,506 | $11,783 | $4,620 | $7,163 |
Source: Public Records
Map
Nearby Homes
- 5310 159th St
- 15804 Laramie Ave Unit 4
- 5137 160th St
- 16000 Long Ave
- 5150 Shadow Creek Dr Unit 4
- 5140 Shadow Creek Dr Unit 1
- 17301 Lockwood Ave
- 16101 Debra Dr
- 16159 Long Ave
- 16352 169 Lot #15 Place
- 16352 169 Lot #13 Place
- 16352 169 Lot #14 Place
- 16352 Place
- 16352 169 Lot #9 Place
- 16352 169 Lot #8 Place
- 16352 169 Lot #7 Place
- 16352 169 Lot #6 Place
- 16352 169 Lot #3 Place
- 14901 S Cicero Ave
- 15601 Latrobe Ave
- 15932 Latrobe Ave
- 15940 Latrobe Ave
- 15944 Latrobe Ave
- 15944 Latrobe Ave Unit 1
- 15944 Latrobe Ave Unit 2
- 15944 Latrobe Ave
- 15928 Latrobe Ave
- 15933 Lockwood Ave
- 15931 Lockwood Ave
- 15945 Lockwood Ave
- 15929 Lockwood Ave
- 15952 Latrobe Ave
- 15935 Latrobe Ave
- 15939 Latrobe Ave
- 15920 Latrobe Ave
- 15927 Latrobe Ave
- 15949 Latrobe Ave
- 15925 Lockwood Ave
- 15953 Lockwood Ave
- 15925 Latrobe Ave