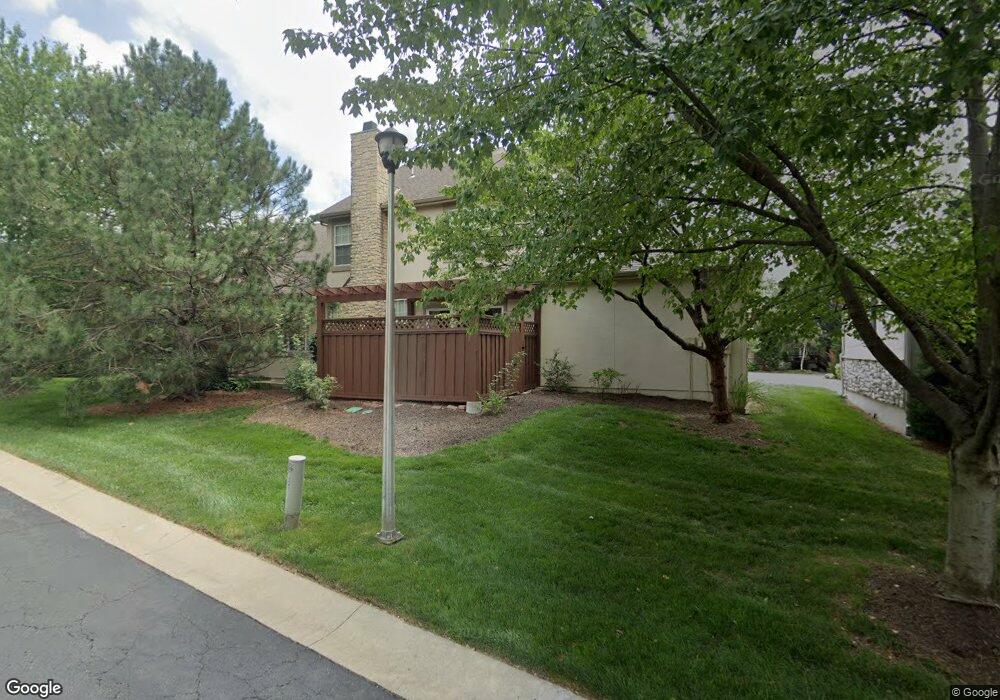
15943 Linden St Stilwell, KS 66085
Estimated Value: $377,000 - $415,000
3
Beds
3
Baths
2,058
Sq Ft
$195/Sq Ft
Est. Value
About This Home
This home is located at 15943 Linden St, Stilwell, KS 66085 and is currently estimated at $400,706, approximately $194 per square foot. 15943 Linden St is a home located in Johnson County with nearby schools including Blue River Elementary School, Blue Valley Middle School, and Blue Valley High School.
Ownership History
Date
Name
Owned For
Owner Type
Purchase Details
Closed on
Aug 5, 2010
Sold by
Federal National Mortgage Association
Bought by
Cook Ryan
Current Estimated Value
Purchase Details
Closed on
May 13, 2010
Sold by
Garoutte Eric B and Garoutte Beverly J
Bought by
Federal National Mortgage Association
Purchase Details
Closed on
Aug 27, 2009
Sold by
Garoutte Beverly J
Bought by
Flowers Tom
Purchase Details
Closed on
Jan 7, 2005
Sold by
Garoutte Eric B
Bought by
Garoutte Beverly J
Purchase Details
Closed on
May 13, 2004
Sold by
Valley Ventures Llc
Bought by
Garoutte Eric B and Garoutte Beverly J
Home Financials for this Owner
Home Financials are based on the most recent Mortgage that was taken out on this home.
Original Mortgage
$183,134
Interest Rate
5.81%
Mortgage Type
Purchase Money Mortgage
Create a Home Valuation Report for This Property
The Home Valuation Report is an in-depth analysis detailing your home's value as well as a comparison with similar homes in the area
Home Values in the Area
Average Home Value in this Area
Purchase History
| Date | Buyer | Sale Price | Title Company |
|---|---|---|---|
| Cook Ryan | -- | Stewart Title | |
| Federal National Mortgage Association | $193,420 | None Available | |
| Flowers Tom | -- | None Available | |
| Garoutte Beverly J | -- | None Available | |
| Garoutte Eric B | -- | Security Land Title Company |
Source: Public Records
Mortgage History
| Date | Status | Borrower | Loan Amount |
|---|---|---|---|
| Previous Owner | Garoutte Eric B | $183,134 | |
| Closed | Garoutte Eric B | $34,337 |
Source: Public Records
Tax History Compared to Growth
Tax History
| Year | Tax Paid | Tax Assessment Tax Assessment Total Assessment is a certain percentage of the fair market value that is determined by local assessors to be the total taxable value of land and additions on the property. | Land | Improvement |
|---|---|---|---|---|
| 2024 | $4,137 | $40,756 | $6,187 | $34,569 |
| 2023 | $3,974 | $38,318 | $6,187 | $32,131 |
| 2022 | $3,668 | $34,753 | $5,382 | $29,371 |
| 2021 | $3,691 | $33,063 | $4,888 | $28,175 |
| 2020 | $3,629 | $32,293 | $4,888 | $27,405 |
| 2019 | $3,486 | $30,372 | $4,589 | $25,783 |
| 2018 | $3,241 | $27,681 | $4,060 | $23,621 |
| 2017 | $3,092 | $25,956 | $3,795 | $22,161 |
| 2016 | $2,955 | $24,794 | $3,795 | $20,999 |
| 2015 | $2,912 | $24,346 | $3,795 | $20,551 |
| 2013 | -- | $20,102 | $3,795 | $16,307 |
Source: Public Records
Map
Nearby Homes
- 4523 W 159th Terrace Unit 120
- 16005 Fontana St Unit 230
- 16009 Fontana St Unit 240
- 16038 Fontana St Unit 605
- 20145 Granada St
- 20125 Granada St
- 20105 Granada St
- 20110 Granada St
- 20120 Granada St
- 20130 Granada St
- 20140 Granada St
- 3900 W 158th Place
- 15845 Buena Vista St
- 15841 Buena Vista St
- 15849 Buena Vista St
- The Oakmont Plan at Mission Ranch - Grand Reserve
- Del Mar Plan at Mission Ranch - Grand Reserve
- Brentwood Plan at Mission Ranch - Grand Reserve
- 4215 W 158th Terrace
- 4211 W 158th Terrace
- 15941 Linden St
- 15945 Linden St
- 15937 Linden St
- 15949 Linden St
- 15933 Linden St
- 15935 Linden St
- 4704 W 159th Terrace
- 15951 Linden St
- 15953 Linden St
- 4706 W 159th Terrace
- 4702 W 159th Terrace
- 15910 Granada St
- 15910 Granada St
- 15910 Granada St Unit 240
- 15910 Granada St Unit 230
- 15910 Granada St Unit 220
- 15910 Granada St Unit 210
- 15910 Granada St Unit 120
- 15910 Granada St Unit 110
- 16109 Linden St