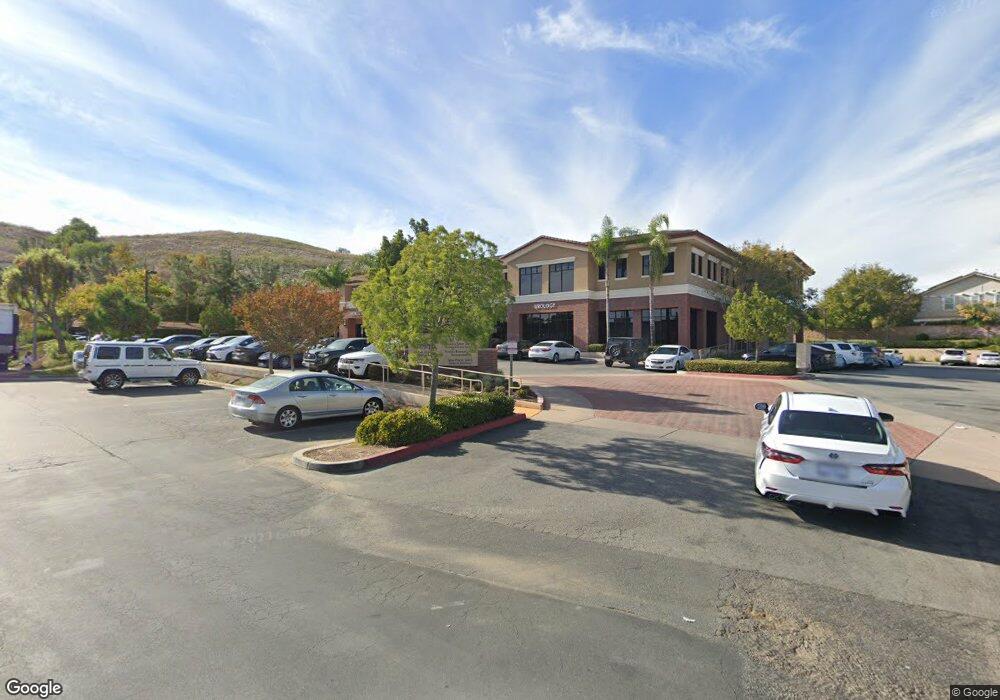
15944 Los Serranos Country Club Dr Unit 180 Chino Hills, CA 91709
Los Serranos NeighborhoodEstimated Value: $930,543
--
Bed
--
Bath
1,261
Sq Ft
$738/Sq Ft
Est. Value
About This Home
This home is located at 15944 Los Serranos Country Club Dr Unit 180, Chino Hills, CA 91709 and is currently estimated at $930,543, approximately $737 per square foot. 15944 Los Serranos Country Club Dr Unit 180 is a home located in San Bernardino County with nearby schools including Michael G. Wickman Elementary School, Robert O. Townsend Junior High School, and Chino Hills High School.
Ownership History
Date
Name
Owned For
Owner Type
Purchase Details
Closed on
Oct 28, 2015
Sold by
Brotman Patricia A
Bought by
15944 Los Serranos Llc
Current Estimated Value
Home Financials for this Owner
Home Financials are based on the most recent Mortgage that was taken out on this home.
Original Mortgage
$181,500
Interest Rate
3.97%
Mortgage Type
Commercial
Purchase Details
Closed on
Apr 13, 2015
Sold by
West Tujunga Officeos Llc
Bought by
West Tujunga Officeos Llc and West Tunjunga Officeos Llc
Home Financials for this Owner
Home Financials are based on the most recent Mortgage that was taken out on this home.
Original Mortgage
$287,500
Interest Rate
3.97%
Mortgage Type
Commercial
Purchase Details
Closed on
Apr 24, 2014
Sold by
Vista San Juan Lp
Bought by
West Tunjunga Officeos Llc
Create a Home Valuation Report for This Property
The Home Valuation Report is an in-depth analysis detailing your home's value as well as a comparison with similar homes in the area
Home Values in the Area
Average Home Value in this Area
Purchase History
| Date | Buyer | Sale Price | Title Company |
|---|---|---|---|
| 15944 Los Serranos Llc | -- | Accommodation | |
| West Tujunga Officeos Llc | $519,500 | North American Title Company | |
| West Tunjunga Officeos Llc | $498,000 | First American Title Ins Co |
Source: Public Records
Mortgage History
| Date | Status | Borrower | Loan Amount |
|---|---|---|---|
| Previous Owner | West Tujunga Officeos Llc | $181,500 | |
| Previous Owner | West Tujunga Officeos Llc | $287,500 |
Source: Public Records
Tax History Compared to Growth
Tax History
| Year | Tax Paid | Tax Assessment Tax Assessment Total Assessment is a certain percentage of the fair market value that is determined by local assessors to be the total taxable value of land and additions on the property. | Land | Improvement |
|---|---|---|---|---|
| 2025 | $7,395 | $614,984 | $59,191 | $555,793 |
| 2024 | $7,395 | $602,925 | $58,030 | $544,895 |
| 2023 | $7,197 | $591,103 | $56,892 | $534,211 |
| 2022 | $7,145 | $579,512 | $55,776 | $523,736 |
| 2021 | $7,005 | $568,149 | $54,682 | $513,467 |
| 2020 | $6,910 | $562,323 | $54,121 | $508,202 |
| 2019 | $6,788 | $551,297 | $53,060 | $498,237 |
| 2018 | $6,641 | $540,488 | $52,020 | $488,468 |
| 2017 | $6,521 | $529,890 | $51,000 | $478,890 |
| 2016 | $6,122 | $519,500 | $50,000 | $469,500 |
| 2015 | $5,961 | $507,950 | $36,719 | $471,231 |
| 2014 | $5,532 | $468,351 | $83,282 | $385,069 |
Source: Public Records
Map
Nearby Homes
- 15892 Tanberry Dr
- 15906 Kingston Rd
- 15849 Tanberry Dr
- 15946 Ellington Way
- 15920 Ellington Way
- 15841 Ellington Way
- 0 Pomona Rincon Rd Unit TR19286701
- 5165 Pomona Rincon Rd
- 5142 Cellini Dr
- 5177 Pomona Rincon Rd
- 4570 Willow Bend Ct
- 15508 Quail St
- 4479 Saint Andrews Dr
- 16349 Misty Hill Dr
- 5521 Stargaze St
- 16340 Willowmist Ct
- 4395 Saint Andrews Dr
- 5176 Glenview St
- 15597 Timberidge Ln
- 4718 El Molino Ln
- 15944 Los Serranos Country Club Dr
- 15944 Los Serranos Country Club Dr Unit 120
- 15944 Los Serranos Country Club Dr Unit 200
- 15944 Los Serranos Country Club Dr Unit 270
- 15944 Los Serranos Unit 250
- 15944 Los Serranos Unit 270
- 15989 Avenal Ct
- 15992 Avenal Ct
- 15988 Avenal Ct
- 15984 Avenal Ct
- 15981 Avenal Ct
- 15976 Avenal Ct
- 15973 Avenal Ct
- 15968 Avenal Ct
- 15942 Los Serranos Country Club Dr
- 15965 Avenal Ct
- 15938 Los Serranos Country Club Dr Unit A
- 15960 Avenal Ct
- 15957 Avenal Ct
- 15952 Avenal Ct