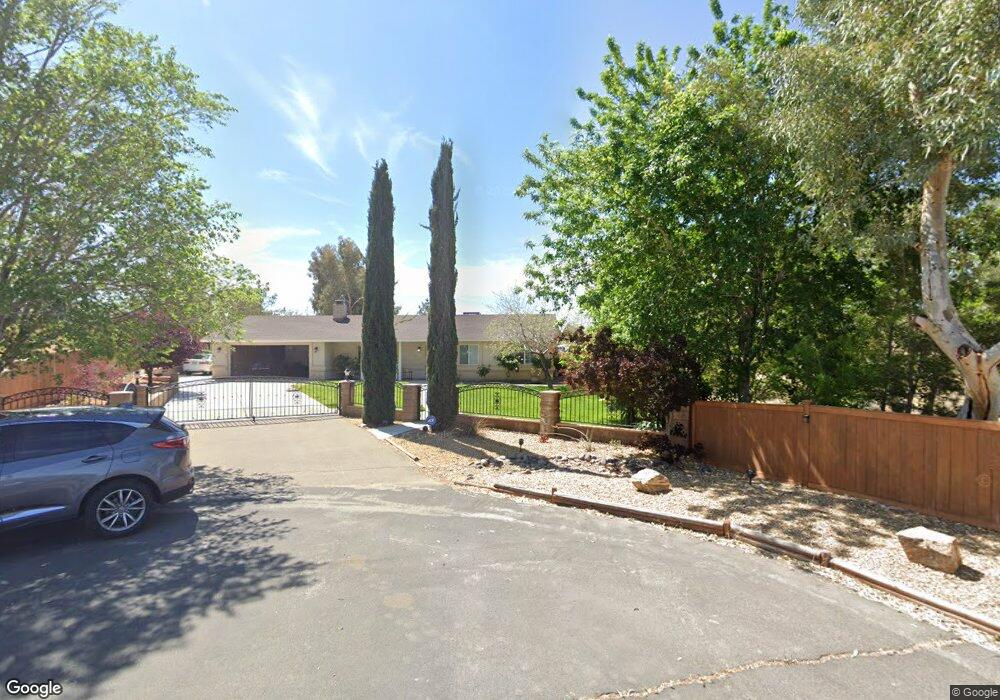
15945 Llano Ct Victorville, CA 92394
Estimated Value: $378,000 - $407,000
4
Beds
3
Baths
1,735
Sq Ft
$226/Sq Ft
Est. Value
About This Home
This home is located at 15945 Llano Ct, Victorville, CA 92394 and is currently estimated at $391,381, approximately $225 per square foot. 15945 Llano Ct is a home located in San Bernardino County with nearby schools including Puesta Del Sol Elementary School, Challenger School Of Sports And Fitness, and Village Elementary School.
Ownership History
Date
Name
Owned For
Owner Type
Purchase Details
Closed on
Aug 26, 2004
Sold by
Sullivan Michael G
Bought by
Sullivan Michael G and Sullivan Ofelia B
Current Estimated Value
Home Financials for this Owner
Home Financials are based on the most recent Mortgage that was taken out on this home.
Original Mortgage
$139,985
Interest Rate
5.92%
Mortgage Type
New Conventional
Purchase Details
Closed on
Dec 3, 1999
Sold by
Federal Home Loan Mortgage Corporation
Bought by
Scharff Ofelia
Home Financials for this Owner
Home Financials are based on the most recent Mortgage that was taken out on this home.
Original Mortgage
$61,905
Interest Rate
7.72%
Mortgage Type
FHA
Purchase Details
Closed on
Jun 23, 1999
Sold by
Frantz Don I
Bought by
Federal Home Loan Mortgage Corporation
Create a Home Valuation Report for This Property
The Home Valuation Report is an in-depth analysis detailing your home's value as well as a comparison with similar homes in the area
Home Values in the Area
Average Home Value in this Area
Purchase History
| Date | Buyer | Sale Price | Title Company |
|---|---|---|---|
| Sullivan Michael G | -- | Stewart Title Of Ca | |
| Scharff Ofelia | $62,000 | Lawyers Title Company | |
| Federal Home Loan Mortgage Corporation | $63,000 | -- |
Source: Public Records
Mortgage History
| Date | Status | Borrower | Loan Amount |
|---|---|---|---|
| Closed | Sullivan Michael G | $139,985 | |
| Closed | Scharff Ofelia | $61,905 | |
| Closed | Scharff Ofelia | $3,100 |
Source: Public Records
Tax History Compared to Growth
Tax History
| Year | Tax Paid | Tax Assessment Tax Assessment Total Assessment is a certain percentage of the fair market value that is determined by local assessors to be the total taxable value of land and additions on the property. | Land | Improvement |
|---|---|---|---|---|
| 2025 | $1,299 | $116,623 | $16,200 | $100,423 |
| 2024 | $1,299 | $114,336 | $15,882 | $98,454 |
| 2023 | $1,283 | $112,095 | $15,571 | $96,524 |
| 2022 | $1,259 | $109,897 | $15,266 | $94,631 |
| 2021 | $1,223 | $107,742 | $14,967 | $92,775 |
| 2020 | $1,200 | $106,638 | $14,814 | $91,824 |
| 2019 | $1,179 | $104,548 | $14,524 | $90,024 |
| 2018 | $1,255 | $102,498 | $14,239 | $88,259 |
| 2017 | $1,227 | $100,488 | $13,960 | $86,528 |
| 2016 | $1,201 | $98,517 | $13,686 | $84,831 |
| 2015 | $1,157 | $97,037 | $13,480 | $83,557 |
| 2014 | $1,133 | $95,136 | $13,216 | $81,920 |
Source: Public Records
Map
Nearby Homes
- 15960 Green Hill Dr
- 0 Barranca Way Unit PW25106825
- 0 Barranca Way Unit PW25106858
- 16028 Green Hill Dr
- 0 Puesta Del Sol Dr Unit HD25159036
- 0 Puesta Del Sol Dr Unit TR25127778
- 16098 Tawney Ridge Ln
- 16079 Tawney Ridge Ln
- 16297 Pepper Tree Dr
- 15975 Village Dr
- 16011 Coronado Dr
- 101 Pepper Tree Dr
- 16299 Pepper Tree Dr
- 15728 La Paz Dr
- 16277 Puesta Del Sol Dr
- 15967 N Culver Rd
- 0 Sueno Ln Unit HD25230918
- 16226 Brookfield Dr
- 16249 Encina St
- 15699 La Verida Dr
- 15897 Sueno Ln
- 15887 Sueno Ln
- 15967 Llano Ct
- 15963 Llano Ct
- 15956 Calandria Way
- 15966 Calandria Way
- 15940 Calandria Way
- 15918 Calandria Way
- 15959 Llano Ln
- 15900 Calandria Way
- 15927 Barranca Way
- 15875 Sueno Ln
- 15882 Calandria Way
- 15889 Sueno Ln
- 15878 Sueno Ln
- 15865 Sueno Ln
- 16003 Llano Ln
- 15980 Llano Ln
- 15947 Calandria Way