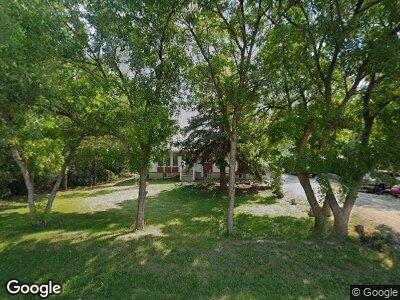
15950 N 6000 W Garland, UT 84312
Estimated Value: $491,000 - $550,000
2
Beds
2
Baths
840
Sq Ft
$628/Sq Ft
Est. Value
About This Home
This home is located at 15950 N 6000 W, Garland, UT 84312 and is currently estimated at $527,333, approximately $627 per square foot. 15950 N 6000 W is a home located in Box Elder County with nearby schools including Fielding School, Bear River Middle School, and Alice C. Harris Intermediate School.
Create a Home Valuation Report for This Property
The Home Valuation Report is an in-depth analysis detailing your home's value as well as a comparison with similar homes in the area
Home Values in the Area
Average Home Value in this Area
Mortgage History
| Date | Status | Borrower | Loan Amount |
|---|---|---|---|
| Closed | Beal Gary K | $56,500 | |
| Closed | Beal Gary K | $10,000 | |
| Closed | Beal Gary K | $40,000 | |
| Closed | Beal Gary K | $19,159 |
Source: Public Records
Tax History Compared to Growth
Tax History
| Year | Tax Paid | Tax Assessment Tax Assessment Total Assessment is a certain percentage of the fair market value that is determined by local assessors to be the total taxable value of land and additions on the property. | Land | Improvement |
|---|---|---|---|---|
| 2024 | $1,783 | $465,539 | $130,000 | $335,539 |
| 2023 | $2,171 | $461,419 | $130,000 | $331,419 |
| 2022 | $1,911 | $238,354 | $35,750 | $202,604 |
| 2021 | $1,517 | $266,790 | $30,000 | $236,790 |
| 2020 | $1,570 | $266,790 | $30,000 | $236,790 |
| 2019 | $1,403 | $125,029 | $16,500 | $108,529 |
| 2018 | $1,033 | $110,873 | $16,500 | $94,373 |
| 2017 | $1,373 | $201,587 | $16,500 | $171,587 |
| 2016 | $877 | $95,182 | $16,500 | $78,682 |
| 2015 | $752 | $88,029 | $16,500 | $71,529 |
| 2014 | $752 | $84,623 | $16,500 | $68,123 |
| 2013 | -- | $78,430 | $16,500 | $61,930 |
Source: Public Records
Map
Nearby Homes
- 16500 N 6000 W
- 16151 N 6125 W Unit 7
- 62 N 900 W
- 7002 W 12800 N
- 16129 N 6125 W Unit 9
- 15125 N 4400 W
- 13189 N Brookside Dr
- 4840 W 14400 N
- 15920 N 4000 W Unit 14
- 15930 N 4000 W
- 169 W 100 N Unit 4
- 136 W Main St
- 18046 N 6000 W
- 18068 N 6000 W
- 210 S 100 E
- 126 N Center St
- 330 N 140 W
- 18136 N 6000 W
- 18188 N 6000 W
- 4770 W 13600 N
- 15950 N 6000 W
- 15940 N 6000 W
- 15980 N 6000 W
- 15985 N 6000 W
- 15955 N 6000 W
- 15910 N 6000 W
- 16031 N 6000 W Unit 2
- 16031 N 6000 W
- 15880 N 6000 W
- 16073 N 6000 W
- 16073 N 6000 W
- 15830 N 6000 W
- 16095 N 6000 W
- 16095 N 6000 W
- 16115 N 6000 W
- 15800 N 6000 W
- 15800 N 6000 W
- 16137 N 6000 W
- 15770 N 6000 W
- 13242 N Brookside Drive Dr E Unit 28