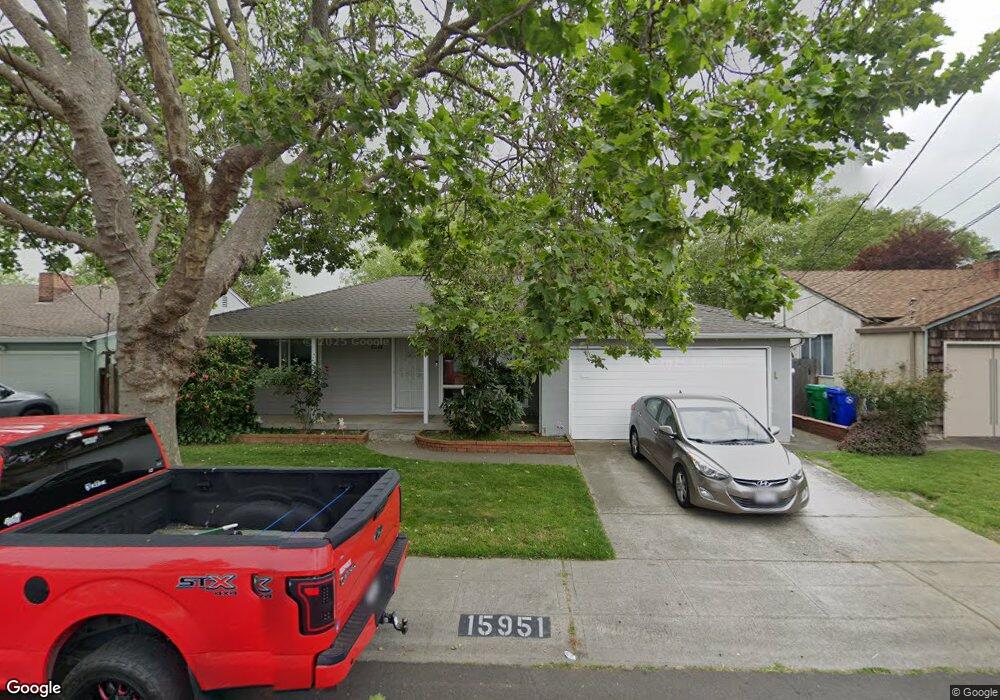
15951 Via Cordoba San Lorenzo, CA 94580
Estimated Value: $752,334 - $796,000
3
Beds
1
Bath
1,077
Sq Ft
$721/Sq Ft
Est. Value
About This Home
This home is located at 15951 Via Cordoba, San Lorenzo, CA 94580 and is currently estimated at $776,334, approximately $720 per square foot. 15951 Via Cordoba is a home located in Alameda County with nearby schools including Grant Elementary School, Washington Manor Middle School, and San Lorenzo High School.
Ownership History
Date
Name
Owned For
Owner Type
Purchase Details
Closed on
Apr 23, 2009
Sold by
Bly David C
Bought by
Tran Jonas Phat K
Current Estimated Value
Home Financials for this Owner
Home Financials are based on the most recent Mortgage that was taken out on this home.
Original Mortgage
$213,750
Outstanding Balance
$135,487
Interest Rate
4.99%
Mortgage Type
Purchase Money Mortgage
Estimated Equity
$640,847
Purchase Details
Closed on
Sep 27, 2005
Sold by
Bly David C
Bought by
Bly David C
Home Financials for this Owner
Home Financials are based on the most recent Mortgage that was taken out on this home.
Original Mortgage
$308,000
Interest Rate
5.7%
Mortgage Type
New Conventional
Create a Home Valuation Report for This Property
The Home Valuation Report is an in-depth analysis detailing your home's value as well as a comparison with similar homes in the area
Home Values in the Area
Average Home Value in this Area
Purchase History
| Date | Buyer | Sale Price | Title Company |
|---|---|---|---|
| Tran Jonas Phat K | $285,000 | North American Title Company | |
| Bly David C | -- | Ticor Title |
Source: Public Records
Mortgage History
| Date | Status | Borrower | Loan Amount |
|---|---|---|---|
| Open | Tran Jonas Phat K | $213,750 | |
| Previous Owner | Bly David C | $308,000 |
Source: Public Records
Tax History Compared to Growth
Tax History
| Year | Tax Paid | Tax Assessment Tax Assessment Total Assessment is a certain percentage of the fair market value that is determined by local assessors to be the total taxable value of land and additions on the property. | Land | Improvement |
|---|---|---|---|---|
| 2025 | $5,068 | $366,985 | $110,095 | $256,890 |
| 2024 | $5,068 | $359,791 | $107,937 | $251,854 |
| 2023 | $5,052 | $352,738 | $105,821 | $246,917 |
| 2022 | $4,971 | $345,824 | $103,747 | $242,077 |
| 2021 | $4,832 | $339,044 | $101,713 | $237,331 |
| 2020 | $4,722 | $335,570 | $100,671 | $234,899 |
| 2019 | $4,722 | $328,991 | $98,697 | $230,294 |
| 2018 | $4,439 | $322,542 | $96,762 | $225,780 |
| 2017 | $4,239 | $316,218 | $94,865 | $221,353 |
| 2016 | $4,043 | $310,020 | $93,006 | $217,014 |
| 2015 | $3,955 | $305,365 | $91,609 | $213,756 |
| 2014 | $3,897 | $299,386 | $89,816 | $209,570 |
Source: Public Records
Map
Nearby Homes
- 16045 Via Cordoba
- 179 Loma Verde Dr
- 181 E Lewelling Blvd
- 15958 Via Descanso
- 17779 Rainier Ave
- 15609 Ronda St
- 16829 Daryl Ave
- 17754 Meekland Ave Unit 1
- 72 Via Morella
- 15867 Hesperian Blvd
- 15539 Usher St
- 15540 Hesperian Blvd
- 18905 Standish Ave
- 920 Elgin St Unit G
- 16277 Ashland Ave
- 638 Paseo Del Rio
- 19539 Meekland Ave
- 19736 Times Ave
- 1045 Delano St
- 334 Oxford St
- 15957 Via Cordoba
- 15945 Via Cordoba
- 15950 Via Marlin
- 15956 Via Marlin
- 15944 Via Marlin
- 15963 Via Cordoba
- 15939 Via Cordoba
- 15954 Via Cordoba
- 15948 Via Cordoba
- 15962 Via Marlin
- 15938 Via Marlin
- 15960 Via Cordoba
- 15942 Via Cordoba
- 15969 Via Cordoba
- 15933 Via Cordoba
- 15966 Via Cordoba
- 15932 Via Marlin
- 15936 Via Cordoba
- 15968 Via Marlin
- 15972 Via Cordoba