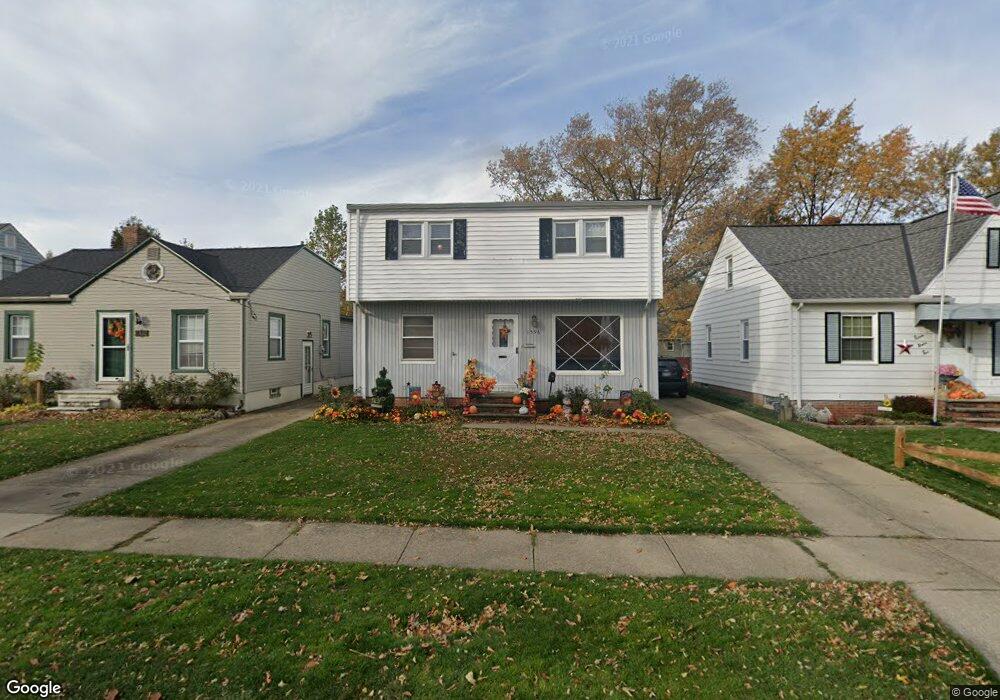
1596 Douglas Rd Wickliffe, OH 44092
Estimated Value: $191,000 - $215,000
4
Beds
2
Baths
840
Sq Ft
$238/Sq Ft
Est. Value
About This Home
This home is located at 1596 Douglas Rd, Wickliffe, OH 44092 and is currently estimated at $199,649, approximately $237 per square foot. 1596 Douglas Rd is a home located in Lake County with nearby schools including Wickliffe Elementary School, Wickliffe Middle School, and Wickliffe High School.
Ownership History
Date
Name
Owned For
Owner Type
Purchase Details
Closed on
Sep 16, 2017
Sold by
Veneskey Donald C and Veneskey Cindy L
Bought by
Veneskey Dena N
Current Estimated Value
Purchase Details
Closed on
Nov 25, 2002
Sold by
Gagliardi Joseph S and Gagliardi Kellie J
Bought by
Veneskey Donald C and Veneskey Cindy L
Home Financials for this Owner
Home Financials are based on the most recent Mortgage that was taken out on this home.
Original Mortgage
$136,360
Outstanding Balance
$58,489
Interest Rate
6.22%
Mortgage Type
FHA
Estimated Equity
$141,160
Purchase Details
Closed on
May 24, 1999
Sold by
Conway David S and Conway Ethel J
Bought by
Gagliardi Joseph S and Gagliardi Kellie J
Home Financials for this Owner
Home Financials are based on the most recent Mortgage that was taken out on this home.
Original Mortgage
$101,500
Interest Rate
6.92%
Purchase Details
Closed on
Jun 20, 1988
Bought by
Conway David S
Create a Home Valuation Report for This Property
The Home Valuation Report is an in-depth analysis detailing your home's value as well as a comparison with similar homes in the area
Home Values in the Area
Average Home Value in this Area
Purchase History
| Date | Buyer | Sale Price | Title Company |
|---|---|---|---|
| Veneskey Dena N | -- | None Available | |
| Veneskey Donald C | $138,500 | Multiple | |
| Gagliardi Joseph S | $126,900 | Midland Title Security Inc | |
| Conway David S | $64,000 | -- |
Source: Public Records
Mortgage History
| Date | Status | Borrower | Loan Amount |
|---|---|---|---|
| Open | Veneskey Donald C | $136,360 | |
| Closed | Gagliardi Joseph S | $101,500 |
Source: Public Records
Tax History Compared to Growth
Tax History
| Year | Tax Paid | Tax Assessment Tax Assessment Total Assessment is a certain percentage of the fair market value that is determined by local assessors to be the total taxable value of land and additions on the property. | Land | Improvement |
|---|---|---|---|---|
| 2024 | -- | $55,070 | $14,050 | $41,020 |
| 2023 | $5,792 | $47,100 | $12,130 | $34,970 |
| 2022 | $3,379 | $47,100 | $12,130 | $34,970 |
| 2021 | $3,392 | $47,100 | $12,130 | $34,970 |
| 2020 | $3,194 | $37,680 | $9,710 | $27,970 |
| 2019 | $3,193 | $37,680 | $9,710 | $27,970 |
| 2018 | $2,518 | $32,440 | $9,470 | $22,970 |
| 2017 | $2,285 | $32,440 | $9,470 | $22,970 |
| 2016 | $2,274 | $32,440 | $9,470 | $22,970 |
| 2015 | $2,233 | $32,440 | $9,470 | $22,970 |
| 2014 | $1,967 | $32,440 | $9,470 | $22,970 |
| 2013 | $1,967 | $32,440 | $9,470 | $22,970 |
Source: Public Records
Map
Nearby Homes
- 1560 Douglas Rd
- 1569 Douglas Rd
- 1648 Douglas Rd
- 1705 Douglas Rd
- 30811 Grant St
- 1590 Dennis Dr
- 5131 Liberty Ln Unit B
- 5084 Shepherds Glen
- 5082 Shepherds Glen
- 5080 Shepherds Glen
- 30530 Grant St
- 5078 Shepherds Glen
- 5076 Shepherds Glen
- 5085 Shepherds Glen
- 5074 Shepherds Glen
- 5083 Shepherds Glen
- 5081 Shepherds Glen
- 5079 Shepherds Glen
- 5068 Shepherds Glen
- 5062 Shepherds Glen
- 1602 Douglas Rd
- 1594 Douglas Rd
- 1606 Douglas Rd
- 1590 Douglas Rd
- 1577 Mapledale Rd
- 1581 Mapledale Rd
- 1573 Mapledale Rd
- 1586 Douglas Rd
- 1585 Mapledale Rd
- 1569 Mapledale Rd
- 1595 Douglas Rd
- 1601 Douglas Rd
- 1565 Mapledale Rd
- 1612 Douglas Rd
- 1582 Douglas Rd
- 1605 Douglas Rd
- 1589 Douglas Rd
- 1589 Mapledale Rd
- 1561 Mapledale Rd
- 1609 Douglas Rd