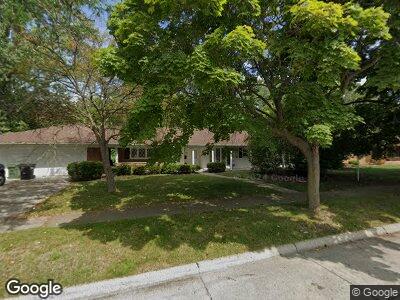
15960 Promenade Ave Unit Bldg-Unit Allen Park, MI 48101
Estimated Value: $272,000 - $392,000
--
Bed
2
Baths
1,985
Sq Ft
$170/Sq Ft
Est. Value
About This Home
This home is located at 15960 Promenade Ave Unit Bldg-Unit, Allen Park, MI 48101 and is currently estimated at $338,372, approximately $170 per square foot. 15960 Promenade Ave Unit Bldg-Unit is a home located in Wayne County with nearby schools including Lindemann Elementary School, Allen Park Middle School, and Allen Park High School.
Ownership History
Date
Name
Owned For
Owner Type
Purchase Details
Closed on
Jan 12, 2018
Sold by
Fannie Mae
Bought by
Quinn Vincent
Current Estimated Value
Home Financials for this Owner
Home Financials are based on the most recent Mortgage that was taken out on this home.
Original Mortgage
$10,000
Outstanding Balance
$8,649
Interest Rate
3.93%
Mortgage Type
New Conventional
Purchase Details
Closed on
May 18, 2017
Sold by
Bruner Leslie J
Bought by
Fannie Mae and Federal National Mortgage Association
Purchase Details
Closed on
Aug 24, 2010
Sold by
Bruner Leslie J and Bruner Violet D
Bought by
Bruner Leslie J and Leslie J Bruner Living Trust
Purchase Details
Closed on
Oct 22, 2001
Sold by
Bruner Violet
Bought by
Bruner Leslie J
Purchase Details
Closed on
Sep 9, 1997
Sold by
Brun Leslie J and Brun Violet
Bought by
Living Trust Violet D Bruner & Violet D Brune
Create a Home Valuation Report for This Property
The Home Valuation Report is an in-depth analysis detailing your home's value as well as a comparison with similar homes in the area
Home Values in the Area
Average Home Value in this Area
Purchase History
| Date | Buyer | Sale Price | Title Company |
|---|---|---|---|
| Quinn Vincent | $125,000 | None Available | |
| Fannie Mae | $119,040 | None Available | |
| Bruner Leslie J | -- | None Available | |
| Bruner Leslie J | -- | -- | |
| Living Trust Violet D Bruner & Violet D Brune | -- | -- |
Source: Public Records
Mortgage History
| Date | Status | Borrower | Loan Amount |
|---|---|---|---|
| Open | Quinn Vincent | $10,000 | |
| Previous Owner | Bruner Leslie J | $128,800 |
Source: Public Records
Tax History Compared to Growth
Tax History
| Year | Tax Paid | Tax Assessment Tax Assessment Total Assessment is a certain percentage of the fair market value that is determined by local assessors to be the total taxable value of land and additions on the property. | Land | Improvement |
|---|---|---|---|---|
| 2024 | $6,994 | $179,900 | $0 | $0 |
| 2023 | $6,683 | $164,300 | $0 | $0 |
| 2022 | $8,006 | $148,600 | $0 | $0 |
| 2021 | $7,783 | $139,200 | $0 | $0 |
| 2020 | $9,999 | $129,400 | $0 | $0 |
| 2019 | $9,761 | $124,500 | $0 | $0 |
| 2018 | $5,723 | $99,800 | $0 | $0 |
| 2017 | $2,079 | $98,600 | $0 | $0 |
| 2016 | $5,277 | $94,600 | $0 | $0 |
| 2015 | $8,319 | $86,600 | $0 | $0 |
| 2013 | $8,059 | $81,700 | $0 | $0 |
| 2012 | $5,678 | $78,700 | $18,900 | $59,800 |
Source: Public Records
Map
Nearby Homes
- 17440 Midway Ave
- 9644 Manor Ave
- 10836 Andrews Ave
- 10065 Northway Ave
- 16185 Goddard Rd
- 18720 Goddard Rd
- 9648 Sterling Ave
- 9914 Fox Ave
- 10052 Allen Pointe Dr
- 10033 Allen Pointe Dr Unit 91
- 10045 Allen Pointe Dr Unit 96
- 18755 Dale Ave
- 9280 Ruth Ave
- 9260 Ruth Ave
- 18859 Moore Ave
- 9064 Becker Ave
- 17620 Rudgate St
- 17285 Rudgate St
- 10854 Allen Rd
- 9732 Rosedale Blvd
- 15960 Promenade Ave Unit Bldg-Unit
- 15960 Promenade Ave
- 15940 Promenade Ave
- 10034 Manor Ave
- 15916 Promenade Ave
- 15963 Promenade Ave
- 15941 Promenade Ave
- 15991 Promenade Ave
- 10013 Manor Ave
- 10091 Reeck Rd
- 10107 Reeck Rd
- 10018 Manor Ave
- 10010 Manor Ave
- 10081 Reeck Rd
- 15921 Promenade Ave
- 15900 Promenade Ave
- 16011 Promenade Ave
- 9997 Manor Ave
- 10071 Reeck Rd
- 15889 Promenade Ave