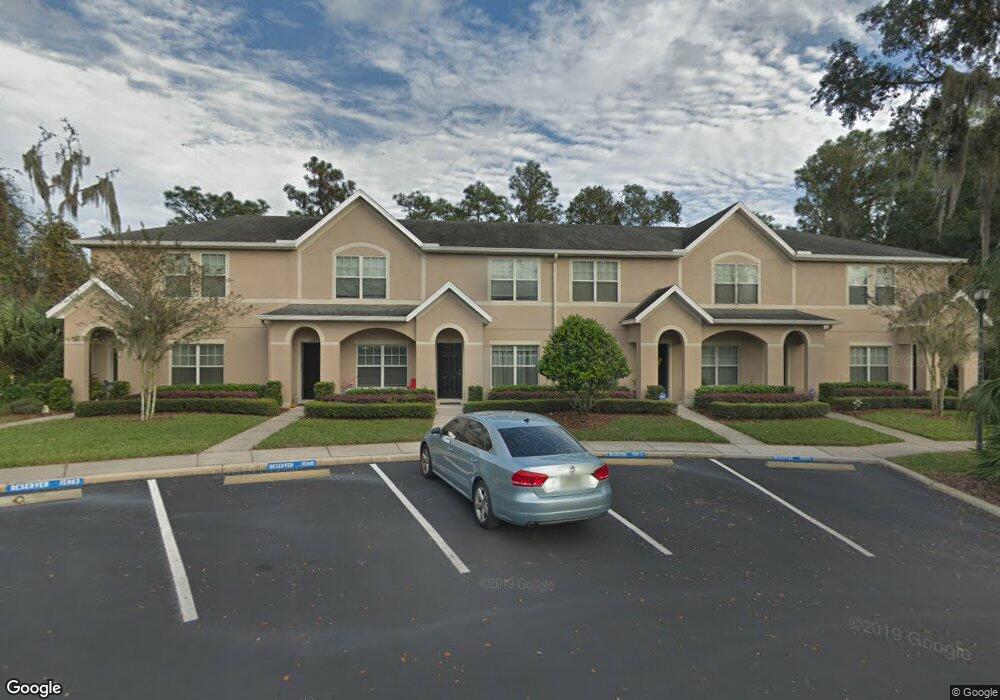
15981 Fishhawk View Dr Unit 2703 Lithia, FL 33547
FishHawk Ranch NeighborhoodEstimated Value: $233,624 - $244,000
2
Beds
3
Baths
1,200
Sq Ft
$199/Sq Ft
Est. Value
About This Home
This home is located at 15981 Fishhawk View Dr Unit 2703, Lithia, FL 33547 and is currently estimated at $239,156, approximately $199 per square foot. 15981 Fishhawk View Dr Unit 2703 is a home located in Hillsborough County with nearby schools including Bevis Elementary School, Barrington Middle School, and Newsome High School.
Ownership History
Date
Name
Owned For
Owner Type
Purchase Details
Closed on
Nov 19, 2019
Sold by
Fu Kam Cheung and Tang Yiqing
Bought by
Carl Randy and Carl Denise
Current Estimated Value
Home Financials for this Owner
Home Financials are based on the most recent Mortgage that was taken out on this home.
Original Mortgage
$149,246
Outstanding Balance
$130,564
Interest Rate
3.75%
Mortgage Type
FHA
Estimated Equity
$108,592
Purchase Details
Closed on
Aug 31, 2017
Sold by
Hoffman Ramsey Ashley E and Hoffman Ashley E
Bought by
Fu Kam Cheung and Tang Yiqing
Purchase Details
Closed on
Jun 13, 2012
Sold by
Beazer Homes Corp
Bought by
Hoffman Ashley E
Home Financials for this Owner
Home Financials are based on the most recent Mortgage that was taken out on this home.
Original Mortgage
$109,024
Interest Rate
3.75%
Mortgage Type
FHA
Create a Home Valuation Report for This Property
The Home Valuation Report is an in-depth analysis detailing your home's value as well as a comparison with similar homes in the area
Home Values in the Area
Average Home Value in this Area
Purchase History
| Date | Buyer | Sale Price | Title Company |
|---|---|---|---|
| Carl Randy | $152,000 | Fidelity Natl Ttl Of Fl Inc | |
| Fu Kam Cheung | $133,000 | Foundation Title & Trust Llc | |
| Hoffman Ashley E | $111,100 | First American Title Ins Co |
Source: Public Records
Mortgage History
| Date | Status | Borrower | Loan Amount |
|---|---|---|---|
| Open | Carl Randy | $149,246 | |
| Previous Owner | Hoffman Ashley E | $109,024 |
Source: Public Records
Tax History
| Year | Tax Paid | Tax Assessment Tax Assessment Total Assessment is a certain percentage of the fair market value that is determined by local assessors to be the total taxable value of land and additions on the property. | Land | Improvement |
|---|---|---|---|---|
| 2025 | $3,170 | $142,188 | -- | -- |
| 2024 | $3,170 | $138,181 | -- | -- |
| 2023 | $3,105 | $134,156 | $0 | $0 |
| 2022 | $3,047 | $130,249 | $0 | $0 |
| 2021 | $2,819 | $126,455 | $0 | $0 |
| 2020 | $2,903 | $124,709 | $12,377 | $112,332 |
| 2019 | $3,533 | $116,701 | $11,572 | $105,129 |
| 2018 | $3,448 | $110,679 | $0 | $0 |
| 2017 | $3,231 | $97,995 | $0 | $0 |
| 2016 | $3,280 | $99,124 | $0 | $0 |
| 2015 | $3,145 | $90,113 | $0 | $0 |
| 2014 | $2,115 | $78,019 | $0 | $0 |
| 2013 | -- | $76,866 | $0 | $0 |
Source: Public Records
Map
Nearby Homes
- 15925 Fishhawk View Dr
- 15844 Fishhawk Falls Dr
- 15856 Fishhawk View Dr
- 15855 Fishhawk View Dr
- 15940 Ternglade Dr
- 15814 Starling Water Dr
- 15733 Fishhawk Falls Dr
- 5860 Fishhawk Ridge Dr
- 5886 Fishhawk Ridge Dr
- 16220 Ternglade Dr
- 15912 Ternglade Dr
- 15929 Ternglade Dr
- 5401 Match Point Place
- 5920 Fishhawk Crossing Blvd
- 16316 Bayberry View Dr
- 5906 Fishhawk Crossing Blvd
- 5908 Beaconpark St
- 15616 Starling Water Dr
- 5914 Beaconpark St
- 5950 Fishhawk Crossing Blvd
- 15981 Fishhawk View Dr
- 15979 Fishhawk View Dr
- 15979 Fishhawk View Dr Unit 2704
- 15983 Fishhawk View Dr
- 15983 Fishhawk View Dr Unit 2702
- 15977 Fishhawk View Dr
- 15975 Fishhawk View Dr
- 15971 Fishhawk View Dr
- 15967 Fishhawk View Dr
- 15967 Fishhawk View Dr Unit 2602
- 15965 Fishhawk View Dr
- 15965 Fishhawk View Dr Unit 2603
- 15963 Fishhawk View Dr
- 15963 Fishhawk View Dr Unit 2604
- 15961 Fishhawk View Dr
- 15961 Fishhawk View Dr Unit 2605
- 15964 Fishhawk View Dr
- 15964 Fishhawk View Dr Unit 2806
- 15959 Fishhawk View Dr
Your Personal Tour Guide
Ask me questions while you tour the home.