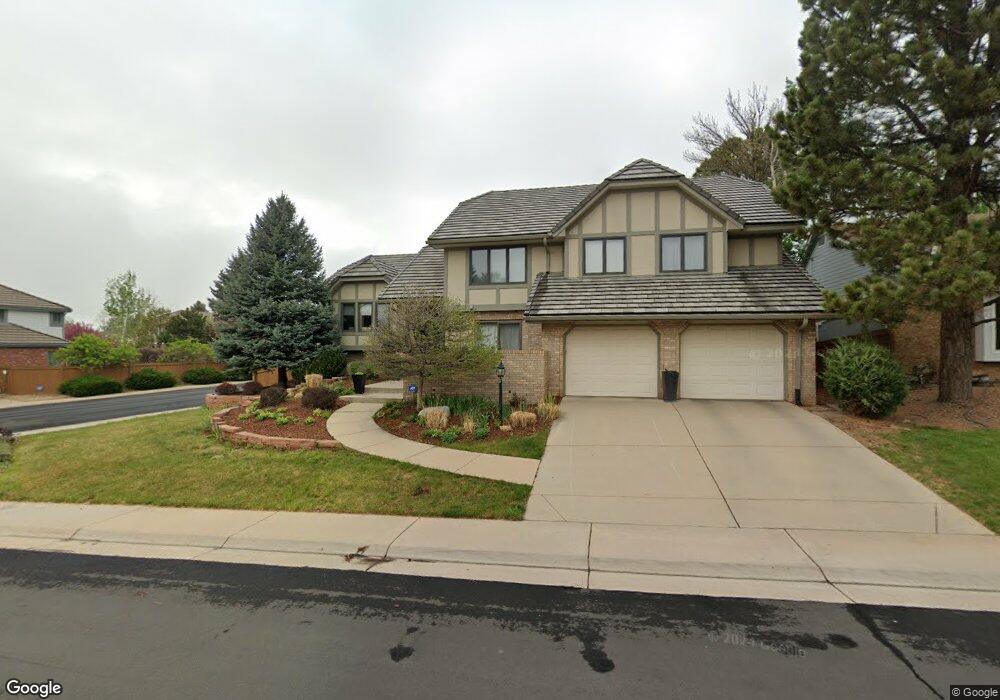
15986 E Crestridge Cir Centennial, CO 80015
Piney Creek NeighborhoodEstimated Value: $698,210 - $872,000
4
Beds
3
Baths
3,877
Sq Ft
$201/Sq Ft
Est. Value
About This Home
This home is located at 15986 E Crestridge Cir, Centennial, CO 80015 and is currently estimated at $778,553, approximately $200 per square foot. 15986 E Crestridge Cir is a home located in Arapahoe County with nearby schools including Indian Ridge Elementary School, Laredo Middle School, and Smoky Hill High School.
Ownership History
Date
Name
Owned For
Owner Type
Purchase Details
Closed on
Aug 11, 2022
Sold by
Sisson Ryan M
Bought by
Sisson Emily S
Current Estimated Value
Purchase Details
Closed on
May 13, 2013
Sold by
Carlsen Robert S and Carlsen Gail R
Bought by
Sisson Ryan M and Sisson Emily S
Home Financials for this Owner
Home Financials are based on the most recent Mortgage that was taken out on this home.
Original Mortgage
$348,800
Interest Rate
3.43%
Mortgage Type
New Conventional
Purchase Details
Closed on
Apr 30, 1992
Sold by
Hicks Sharlet K
Bought by
Carlsen Gail R Carlsen Robert S
Purchase Details
Closed on
Jun 30, 1988
Sold by
Conversion Arapco
Bought by
Hicks Sharlet K
Purchase Details
Closed on
Apr 1, 1985
Sold by
Conversion Arapco
Bought by
Conversion Arapco
Purchase Details
Closed on
Mar 1, 1984
Bought by
Conversion Arapco
Create a Home Valuation Report for This Property
The Home Valuation Report is an in-depth analysis detailing your home's value as well as a comparison with similar homes in the area
Home Values in the Area
Average Home Value in this Area
Purchase History
| Date | Buyer | Sale Price | Title Company |
|---|---|---|---|
| Sisson Emily S | -- | Land Title Guarantee | |
| Sisson Ryan M | $436,000 | First American | |
| Carlsen Gail R Carlsen Robert S | -- | -- | |
| Hicks Sharlet K | -- | -- | |
| Conversion Arapco | -- | -- | |
| Conversion Arapco | -- | -- |
Source: Public Records
Mortgage History
| Date | Status | Borrower | Loan Amount |
|---|---|---|---|
| Previous Owner | Sisson Ryan M | $348,800 |
Source: Public Records
Tax History
| Year | Tax Paid | Tax Assessment Tax Assessment Total Assessment is a certain percentage of the fair market value that is determined by local assessors to be the total taxable value of land and additions on the property. | Land | Improvement |
|---|---|---|---|---|
| 2025 | $5,050 | $49,894 | -- | -- |
| 2024 | $4,493 | $47,523 | -- | -- |
| 2023 | $4,493 | $47,523 | $0 | $0 |
| 2022 | $3,884 | $38,768 | $0 | $0 |
| 2021 | $3,898 | $38,768 | $0 | $0 |
| 2020 | $3,846 | $39,032 | $0 | $0 |
| 2019 | $3,711 | $39,032 | $0 | $0 |
| 2018 | $4,039 | $38,160 | $0 | $0 |
| 2017 | $3,971 | $38,160 | $0 | $0 |
| 2016 | $4,118 | $37,611 | $0 | $0 |
| 2015 | $3,976 | $37,611 | $0 | $0 |
| 2014 | $3,115 | $26,403 | $0 | $0 |
| 2013 | -- | $27,500 | $0 | $0 |
Source: Public Records
Map
Nearby Homes
- 5426 S Jasper Way
- 16395 E Crestline Place
- 5560 S Hannibal Way
- 15406 E Dorado Ave
- 5151 S Laredo Ct
- 16639 E Berry Ln
- 16224 E Belleview Dr
- 15572 E Progress Cir
- 15722 E Progress Dr
- 15746 E Aberdeen Ave
- 5101 S Olathe Cir
- 5752 S Ouray Ct
- 17013 E Berry Place
- 14791 E Poundstone Dr
- 14801 E Poundstone Dr
- 16788 E Belleview Place
- 14933 E Belleview Dr
- 5134 S Ouray Ct
- 5229 S Pagosa Way
- 5118 S Pagosa St
- 15976 E Crestridge Cir
- 5496 S Jasper Way
- 5492 S Jasper Way
- 15985 E Crestridge Cir
- 15956 E Crestridge Cir
- 15975 E Crestridge Cir
- 5490 S Jasper Way
- 5504 S Jasper Way
- 5597 S Jasper Way
- 5588 S Jasper Way
- 15946 E Crestridge Cir
- 15955 E Crestridge Cir
- 5495 S Jasper Way
- 5486 S Jasper Way
- 5593 S Jasper Way
- 5489 S Jasper Ct
- 5508 S Jasper Way
- 5503 S Jasper Way
- 5584 S Jasper Way
- 15945 E Crestridge Cir
Your Personal Tour Guide
Ask me questions while you tour the home.