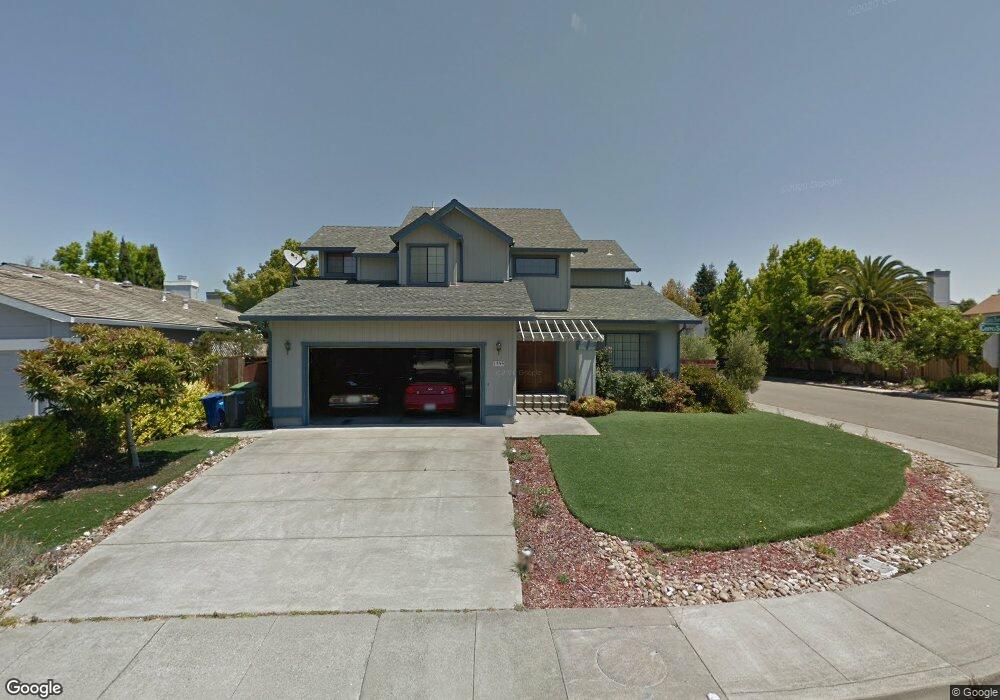
1599 Cerro Sonoma Cir Unit 4 Petaluma, CA 94954
Adobe NeighborhoodEstimated Value: $877,461 - $1,056,000
4
Beds
3
Baths
2,113
Sq Ft
$457/Sq Ft
Est. Value
About This Home
This home is located at 1599 Cerro Sonoma Cir Unit 4, Petaluma, CA 94954 and is currently estimated at $964,615, approximately $456 per square foot. 1599 Cerro Sonoma Cir Unit 4 is a home located in Sonoma County with nearby schools including Kenilworth Junior High School, Casa Grande High School, and River Montessori Elementary Charter School.
Ownership History
Date
Name
Owned For
Owner Type
Purchase Details
Closed on
Feb 22, 2011
Sold by
Alioto John G and Alioto Eola L
Bought by
Alioto John G
Current Estimated Value
Home Financials for this Owner
Home Financials are based on the most recent Mortgage that was taken out on this home.
Original Mortgage
$330,000
Outstanding Balance
$227,731
Interest Rate
4.96%
Mortgage Type
New Conventional
Estimated Equity
$736,884
Purchase Details
Closed on
Apr 30, 2001
Sold by
Alioto John G and Alioto Catherine M
Bought by
Alioto John G and Alioto Eola L
Home Financials for this Owner
Home Financials are based on the most recent Mortgage that was taken out on this home.
Original Mortgage
$201,000
Interest Rate
7.03%
Purchase Details
Closed on
Mar 11, 2000
Sold by
Alioto Catherine and Alioto Catherine M
Bought by
Alioto John G
Create a Home Valuation Report for This Property
The Home Valuation Report is an in-depth analysis detailing your home's value as well as a comparison with similar homes in the area
Home Values in the Area
Average Home Value in this Area
Purchase History
| Date | Buyer | Sale Price | Title Company |
|---|---|---|---|
| Alioto John G | $75,500 | Lsi | |
| Alioto John G | $57,000 | North Bay Title Co | |
| Alioto John G | -- | -- |
Source: Public Records
Mortgage History
| Date | Status | Borrower | Loan Amount |
|---|---|---|---|
| Open | Alioto John G | $330,000 | |
| Previous Owner | Alioto John G | $201,000 |
Source: Public Records
Tax History Compared to Growth
Tax History
| Year | Tax Paid | Tax Assessment Tax Assessment Total Assessment is a certain percentage of the fair market value that is determined by local assessors to be the total taxable value of land and additions on the property. | Land | Improvement |
|---|---|---|---|---|
| 2025 | $4,100 | $369,053 | $124,626 | $244,427 |
| 2024 | $4,100 | $361,818 | $122,183 | $239,635 |
| 2023 | $4,100 | $354,725 | $119,788 | $234,937 |
| 2022 | $4,007 | $347,771 | $117,440 | $230,331 |
| 2021 | $3,960 | $340,953 | $115,138 | $225,815 |
| 2020 | $3,907 | $337,458 | $113,958 | $223,500 |
| 2019 | $3,866 | $330,842 | $111,724 | $219,118 |
| 2018 | $3,753 | $324,356 | $109,534 | $214,822 |
| 2017 | $3,697 | $317,997 | $107,387 | $210,610 |
| 2016 | $3,579 | $311,763 | $105,282 | $206,481 |
| 2015 | $3,486 | $307,081 | $103,701 | $203,380 |
| 2014 | $3,450 | $301,067 | $101,670 | $199,397 |
Source: Public Records
Map
Nearby Homes
- 1727 Chinar Dr
- 1694 Southridge Dr
- 12 Birnam Wood Ct
- 2014 Crinella Dr
- 1878 Adobe Creek Dr
- 1917 Falcon Ridge Dr
- 2 Wedgewood Ct
- 1120 S Mcdowell Blvd
- 1052 Helen Ct
- 4 Starling Dr
- 1513 Elizabeth Dr
- 1103 Marylyn Cir
- 602 Marylyn Cir
- 601 Marylyn Cir Unit 21
- 2189 Saint Augustine Cir
- 1302 Marylyn Cir
- 1711 Capistrano Dr
- 1158 San Rafael Dr
- 859 S Mcdowell Blvd
- 827 Grouse Ln
- 1643 Calle Ranchero
- 1643 Calle Ranchero Unkn
- 1605 Cerro Sonoma Cir
- 1591 Cerro Sonoma Cir
- 1647 Calle Ranchero
- 1600 Cerro Sonoma Cir
- 1631 Calle Ranchero
- 1604 Cerro Sonoma Cir
- 1651 Calle Ranchero
- 1587 Cerro Sonoma Cir
- 1609 Cerro Sonoma Cir
- 1608 Cerro Sonoma Cir
- 1627 Calle Ranchero
- 1655 Calle Ranchero Unkn
- 1588 Cerro Sonoma Cir
- 1655 Calle Ranchero
- 1655 Calle Ranchero None
- 1583 Cerro Sonoma Cir
- 1613 Cerro Sonoma Cir