Estimated Value: $511,000 - $661,000
4
Beds
2
Baths
1,556
Sq Ft
$393/Sq Ft
Est. Value
About This Home
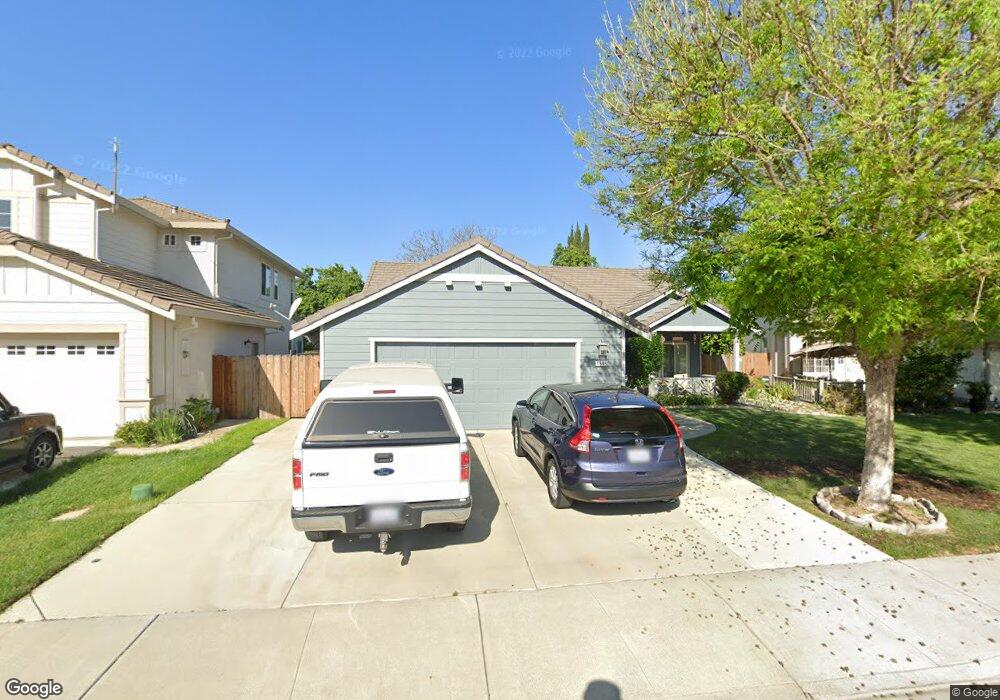
This home is located at 1599 Cindy Way, Tracy, CA 95377 and is currently estimated at $611,340, approximately $392 per square foot. 1599 Cindy Way is a home located in San Joaquin County with nearby schools including Art Freiler, Merrill F. West High School, and Tracy Independent Study Charter School.
Ownership History
Date
Name
Owned For
Owner Type
Purchase Details
Closed on
Jun 26, 2019
Sold by
Davis Ernest
Bought by
Davis Ernest R and The Ernest R Davis Living Trust
Current Estimated Value
Purchase Details
Closed on
Apr 6, 2009
Sold by
Chesnut George W and Estate Of Ruby J Chestnut
Bought by
Davis Ernest and Davis Linda A
Home Financials for this Owner
Home Financials are based on the most recent Mortgage that was taken out on this home.
Original Mortgage
$192,000
Outstanding Balance
$122,155
Interest Rate
5.06%
Mortgage Type
Purchase Money Mortgage
Estimated Equity
$489,185
Purchase Details
Closed on
Nov 14, 2008
Sold by
Chestnut Arthur B and Juanita Chesnut R
Bought by
Chesnut Ruby J
Purchase Details
Closed on
Dec 1, 1998
Sold by
Morrison Homes Inc
Bought by
Chesnut Arthur B and Chesnut Juanita
Create a Home Valuation Report for This Property
The Home Valuation Report is an in-depth analysis detailing your home's value as well as a comparison with similar homes in the area
Home Values in the Area
Average Home Value in this Area
Purchase History
We collect this data history from publicly available records. To have your information removed, we recommend requesting removal directly through your county’s website.
| Date | Buyer | Sale Price | Title Company |
|---|---|---|---|
| Davis Ernest R | -- | None Available | |
| Davis Ernest | $240,000 | Old Republic Title Company | |
| Chesnut Ruby J | -- | None Available | |
| Chesnut Arthur B | $212,000 | First American |
Source: Public Records
Mortgage History
We collect this data history from publicly available records. To have your information removed, we recommend requesting removal directly through your county’s website.
| Date | Status | Borrower | Loan Amount |
|---|---|---|---|
| Open | Davis Ernest | $192,000 |
Source: Public Records
Tax History
| Year | Tax Paid | Tax Assessment Tax Assessment Total Assessment is a certain percentage of the fair market value that is determined by local assessors to be the total taxable value of land and additions on the property. | Land | Improvement |
|---|---|---|---|---|
| 2025 | $3,651 | $309,043 | $77,259 | $231,784 |
| 2024 | $3,370 | $302,985 | $75,745 | $227,240 |
| 2023 | $3,315 | $297,045 | $74,260 | $222,785 |
| 2022 | $3,612 | $291,221 | $72,804 | $218,417 |
| 2021 | $4,374 | $285,512 | $71,377 | $214,135 |
| 2020 | $4,329 | $282,586 | $70,646 | $211,940 |
| 2019 | $4,224 | $277,046 | $69,261 | $207,785 |
| 2018 | $4,138 | $271,614 | $67,903 | $203,711 |
| 2017 | $4,031 | $266,289 | $66,572 | $199,717 |
| 2016 | $4,105 | $261,069 | $65,267 | $195,802 |
| 2014 | $3,930 | $252,115 | $63,029 | $189,086 |
Source: Public Records
Map
Nearby Homes
- 2431 Ogden Sannazor Ct
- 2236 Sabrina Way
- 2180 Jenni Ln
- 2547 Spencer Ln
- 1263 Plaza Ct
- 1233 Plaza Ct
- 1843 Rochester St
- 1723 Duke Ct
- 2834 Hawkins Ct
- 2939 Kennsington Ct
- 1977 Grove Ct
- 1936 Maplegrove Ln
- 1555 Lankershire Dr
- 3030 W Byron Rd
- 840 Saffron Dr
- 2219 Yellowstone Ave
- 1214 Dover Ln
- 1827 Groveview Way
- 8300 W 11th St
- 1720 Treehaven Ln
- 1589 Cindy Way
- 1609 Cindy Way
- 2432 Dorset Ln
- 2422 Dorset Ln
- 1579 Cindy Way
- 2442 Dorset Ln
- 2391 Alexis Ln
- 1598 Cindy Way
- 1588 Cindy Way
- 1569 Cindy Way
- 2452 Dorset Ln
- 2381 Alexis Ln
- 2457 Peppercorn Ln
- 1578 Cindy Way
- 2371 Alexis Ln
- 1559 Cindy Way
- 1568 Cindy Way
- 2433 Dorset Ln
- 1587 Arrigotti Ln
- 2443 Dorset Ln
Your Personal Tour Guide
Ask me questions while you tour the home.