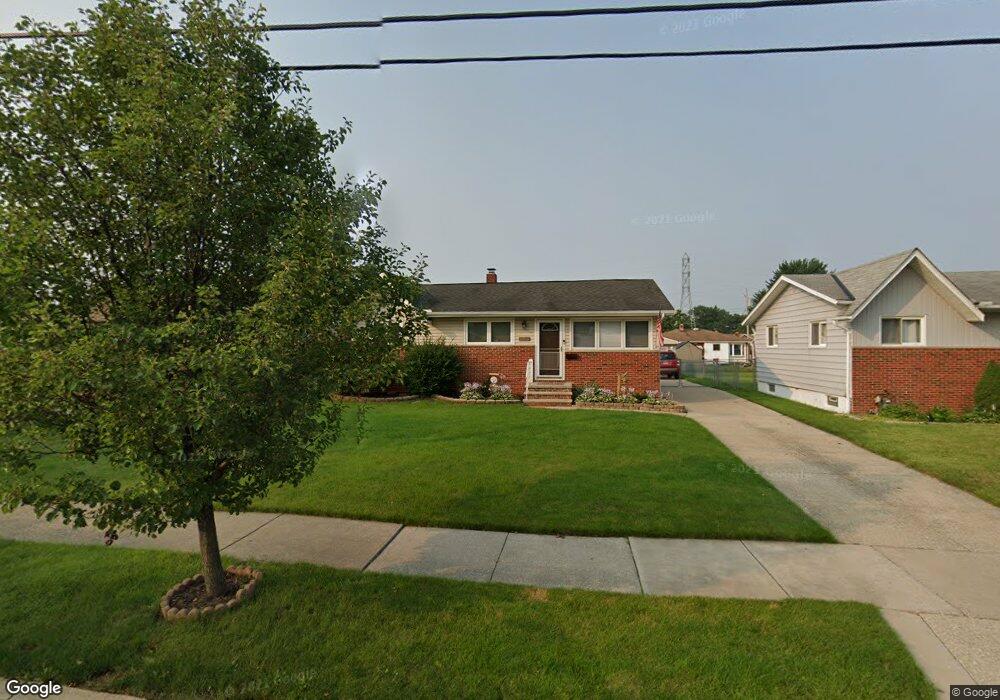
15993 Hocking Blvd Brookpark, OH 44142
Estimated Value: $165,531 - $226,000
3
Beds
2
Baths
952
Sq Ft
$212/Sq Ft
Est. Value
About This Home
This home is located at 15993 Hocking Blvd, Brookpark, OH 44142 and is currently estimated at $202,133, approximately $212 per square foot. 15993 Hocking Blvd is a home located in Cuyahoga County with nearby schools including Berea-Midpark Middle School, Berea-Midpark High School, and Huber Heights Preparatory Academy Parma Academy.
Ownership History
Date
Name
Owned For
Owner Type
Purchase Details
Closed on
Mar 23, 2010
Sold by
Bloch Sheldon
Bought by
Freed Mary L
Current Estimated Value
Home Financials for this Owner
Home Financials are based on the most recent Mortgage that was taken out on this home.
Original Mortgage
$45,000
Outstanding Balance
$29,795
Interest Rate
4.96%
Mortgage Type
New Conventional
Estimated Equity
$172,338
Purchase Details
Closed on
Nov 17, 2009
Sold by
Patty Richard A and Patty Lisa M
Bought by
Bloch Sheldon
Purchase Details
Closed on
Aug 12, 1998
Sold by
Loepp Bertha E Trs
Bought by
Patty Richard A and Patty Lisa M
Home Financials for this Owner
Home Financials are based on the most recent Mortgage that was taken out on this home.
Original Mortgage
$103,900
Interest Rate
6.99%
Mortgage Type
FHA
Purchase Details
Closed on
Dec 18, 1981
Sold by
Loepp Paul G and Loepp Bertha E
Bought by
Loepp Paul G and Loepp Bertha E
Purchase Details
Closed on
Jan 1, 1975
Bought by
Loepp Paul G and Loepp Bertha E
Create a Home Valuation Report for This Property
The Home Valuation Report is an in-depth analysis detailing your home's value as well as a comparison with similar homes in the area
Home Values in the Area
Average Home Value in this Area
Purchase History
| Date | Buyer | Sale Price | Title Company |
|---|---|---|---|
| Freed Mary L | $124,900 | Guardian Title | |
| Bloch Sheldon | $75,400 | Attorney | |
| Patty Richard A | $104,000 | -- | |
| Loepp Paul G | -- | -- | |
| Loepp Paul G | -- | -- |
Source: Public Records
Mortgage History
| Date | Status | Borrower | Loan Amount |
|---|---|---|---|
| Open | Freed Mary L | $45,000 | |
| Previous Owner | Patty Richard A | $103,900 |
Source: Public Records
Tax History
| Year | Tax Paid | Tax Assessment Tax Assessment Total Assessment is a certain percentage of the fair market value that is determined by local assessors to be the total taxable value of land and additions on the property. | Land | Improvement |
|---|---|---|---|---|
| 2024 | $2,897 | $57,435 | $11,760 | $45,675 |
| 2023 | $2,659 | $43,650 | $8,540 | $35,110 |
| 2022 | $2,640 | $43,650 | $8,540 | $35,110 |
| 2021 | $2,625 | $43,650 | $8,540 | $35,110 |
| 2020 | $2,367 | $34,650 | $6,790 | $27,860 |
| 2019 | $2,296 | $99,000 | $19,400 | $79,600 |
| 2018 | $2,195 | $34,650 | $6,790 | $27,860 |
| 2017 | $2,279 | $31,890 | $6,690 | $25,200 |
| 2016 | $2,260 | $31,890 | $6,690 | $25,200 |
| 2015 | $2,233 | $31,890 | $6,690 | $25,200 |
| 2014 | $2,233 | $33,570 | $7,040 | $26,530 |
Source: Public Records
Map
Nearby Homes
- 16117 Hocking Blvd
- 16001 Sylvia Dr
- 15532 Rademaker Dr
- 6131 Hardin Dr
- 15995 Hummel Rd
- 16379 Hummel Rd
- 15497 Hummel Rd
- 6040 Slater Dr
- 6363 Lockhaven Dr
- 15633 Harrison Dr
- 5727 Gateway Ln Unit 1203
- 6014 Westbrook Dr
- 6213 Siegler Dr
- 6210 Siegler Dr
- 14024 Donald Dr
- 15504 Roxboro Dr
- 6572 Liberty Bell Dr Unit 23C
- 13874 Heatherwood Dr
- 6710 Woodruff Ct
- 14398 Sheldon Rd
- 16023 Hocking Blvd
- 15965 Hocking Blvd
- 16045 Hocking Blvd
- 16058 Paulding Blvd
- 16032 Paulding Blvd
- 16082 Paulding Blvd
- 16069 Hocking Blvd
- 16104 Paulding Blvd
- 15925 Hocking Blvd
- 15986 Hocking Blvd
- 16014 Hocking Blvd
- 15962 Hocking Blvd
- 16126 Paulding Blvd
- 15980 Paulding Blvd
- 16038 Hocking Blvd
- 16091 Hocking Blvd
- 15903 Hocking Blvd
- 16060 Hocking Blvd
- 16146 Paulding Blvd
- 15910 Hocking Blvd
Your Personal Tour Guide
Ask me questions while you tour the home.