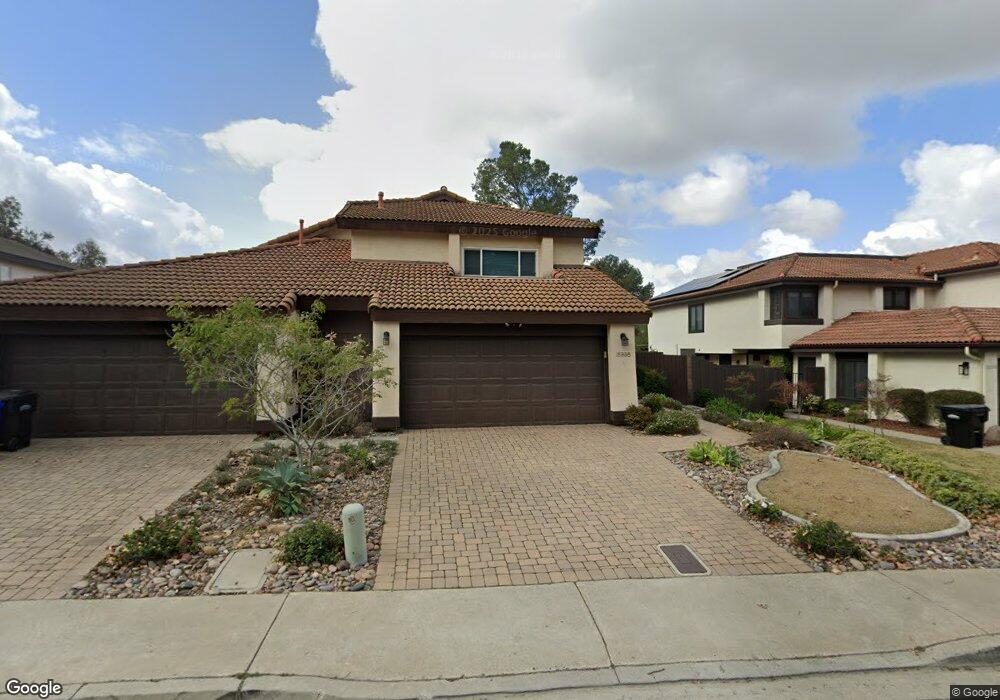
15998 Big Springs Way San Diego, CA 92127
Rancho Bernardo NeighborhoodEstimated Value: $1,013,899 - $1,282,000
3
Beds
3
Baths
1,607
Sq Ft
$704/Sq Ft
Est. Value
About This Home
This home is located at 15998 Big Springs Way, San Diego, CA 92127 and is currently estimated at $1,131,975, approximately $704 per square foot. 15998 Big Springs Way is a home located in San Diego County with nearby schools including Turtleback Elementary, Bernardo Heights Middle, and Rancho Bernardo High.
Ownership History
Date
Name
Owned For
Owner Type
Purchase Details
Closed on
Dec 7, 2009
Sold by
Delucia Jon D and Delucia Deborah L
Bought by
Delucia Jon G and Delucia Deborah L
Current Estimated Value
Purchase Details
Closed on
Jun 25, 1996
Sold by
Mccoy Barbara E
Bought by
Delucia Jon G and Delucia Deborah L
Home Financials for this Owner
Home Financials are based on the most recent Mortgage that was taken out on this home.
Original Mortgage
$150,000
Outstanding Balance
$10,922
Interest Rate
8.32%
Estimated Equity
$1,121,053
Purchase Details
Closed on
Sep 13, 1995
Sold by
Mccoy Barbara E
Bought by
Mccoy Barbara E
Purchase Details
Closed on
Sep 15, 1993
Sold by
Mccoy Barbara E
Bought by
Mccoy Barbara E
Home Financials for this Owner
Home Financials are based on the most recent Mortgage that was taken out on this home.
Original Mortgage
$123,000
Interest Rate
6.98%
Purchase Details
Closed on
Feb 21, 1985
Create a Home Valuation Report for This Property
The Home Valuation Report is an in-depth analysis detailing your home's value as well as a comparison with similar homes in the area
Home Values in the Area
Average Home Value in this Area
Purchase History
| Date | Buyer | Sale Price | Title Company |
|---|---|---|---|
| Delucia Jon G | -- | None Available | |
| Delucia Jon G | $187,500 | Fidelity National Title | |
| Mccoy Barbara E | -- | -- | |
| Mccoy Barbara E | -- | Commonwealth Land Title Co | |
| -- | $125,000 | -- |
Source: Public Records
Mortgage History
| Date | Status | Borrower | Loan Amount |
|---|---|---|---|
| Open | Delucia Jon G | $150,000 | |
| Previous Owner | Mccoy Barbara E | $123,000 |
Source: Public Records
Tax History Compared to Growth
Tax History
| Year | Tax Paid | Tax Assessment Tax Assessment Total Assessment is a certain percentage of the fair market value that is determined by local assessors to be the total taxable value of land and additions on the property. | Land | Improvement |
|---|---|---|---|---|
| 2025 | $3,348 | $305,350 | $108,905 | $196,445 |
| 2024 | $3,348 | $299,364 | $106,770 | $192,594 |
| 2023 | $3,275 | $293,495 | $104,677 | $188,818 |
| 2022 | $3,219 | $287,741 | $102,625 | $185,116 |
| 2021 | $3,176 | $282,100 | $100,613 | $181,487 |
| 2020 | $3,133 | $279,209 | $99,582 | $179,627 |
| 2019 | $3,051 | $273,735 | $97,630 | $176,105 |
| 2018 | $2,965 | $268,368 | $95,716 | $172,652 |
| 2017 | $83 | $263,107 | $93,840 | $169,267 |
| 2016 | $2,823 | $257,949 | $92,000 | $165,949 |
| 2015 | $2,781 | $254,076 | $90,619 | $163,457 |
| 2014 | $2,715 | $249,100 | $88,844 | $160,256 |
Source: Public Records
Map
Nearby Homes
- 15353 Maturin Dr Unit 115
- 15373 Maturin Dr Unit 178
- 15283 Maturin Dr Unit 62
- 11781 Caminito de Las Missiones
- 15273 Maturin Dr Unit 40
- 11705 Via Medanos
- 16003 Caminito de Linda
- 11263 Avenida de Los Lobos Unit D
- 11313 Avenida de Los Lobos Unit B
- 15610 Corte Raposo
- 16232 Avenida Venusto Unit B
- 16244 Avenida Venusto Unit A
- 16205 Via Embeleso
- 16430 Avenida Venusto Unit D
- 15985 Camino Crisalida Unit 5
- 15541 Paseo Jenghiz
- 12141 Iron View Row
- 11385 Paseo Albacete
- 12105 View Pointe Row
- 11384 Almazon St
- 16008 Big Springs Way
- 15990 Big Springs Way
- 16016 Big Springs Way
- 15982 Big Springs Way
- 16024 Big Springs Way
- 15974 Big Springs Way
- 16030 Big Springs Way
- 15966 Big Springs Way
- 16036 Big Springs Way
- 15958 Big Springs Way
- 16015 Big Springs Way
- 16023 Big Springs Way
- 15950 Big Springs Way
- 16042 Big Springs Way
- 16031 Big Springs Way
- 15942 Big Springs Way
- 16050 Big Springs Way
- 16039 Big Springs Way
- 15934 Big Springs Way
- 16047 Big Springs Way