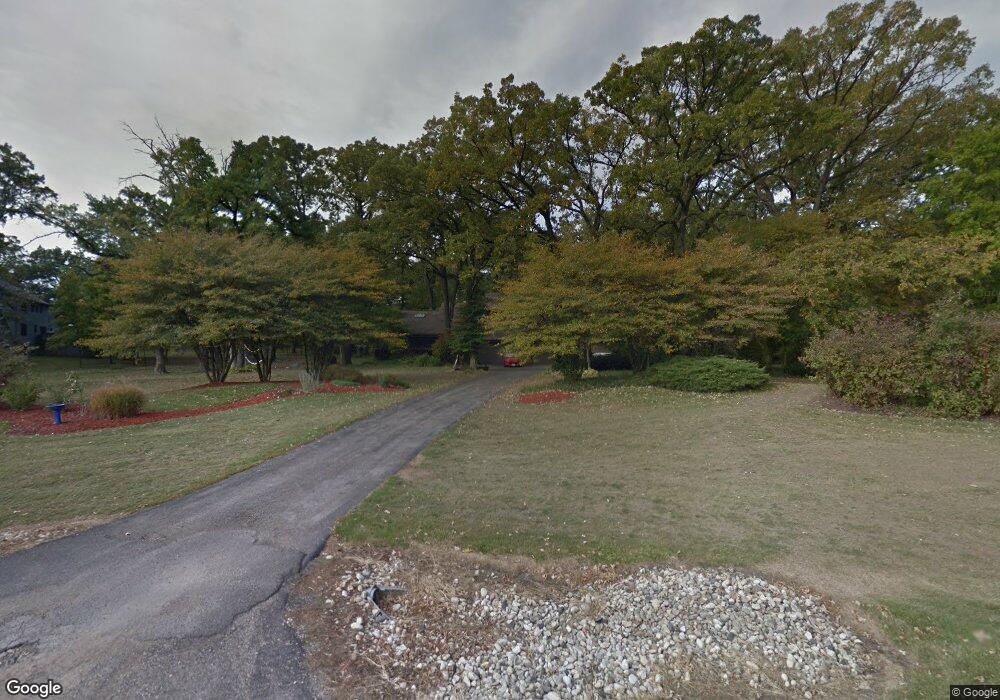
15N568 Red Leaf Rd Hampshire, IL 60140
Far West Elgin NeighborhoodEstimated Value: $546,000 - $753,000
5
Beds
3
Baths
2,590
Sq Ft
$232/Sq Ft
Est. Value
About This Home
This home is located at 15N568 Red Leaf Rd, Hampshire, IL 60140 and is currently estimated at $601,858, approximately $232 per square foot. 15N568 Red Leaf Rd is a home located in Kane County with nearby schools including Gary D. Wright Elementary School, Hampshire Middle School, and Hampshire High School.
Ownership History
Date
Name
Owned For
Owner Type
Purchase Details
Closed on
May 20, 2005
Sold by
Ward James B and Ward Barbara R
Bought by
Harris Charles and Harris Lisa
Current Estimated Value
Home Financials for this Owner
Home Financials are based on the most recent Mortgage that was taken out on this home.
Original Mortgage
$225,000
Outstanding Balance
$120,390
Interest Rate
6.25%
Mortgage Type
New Conventional
Estimated Equity
$481,468
Purchase Details
Closed on
Nov 20, 2001
Sold by
Ward James B and Ward Barbara R
Bought by
Ward James B and Ward Barbara R
Purchase Details
Closed on
Mar 22, 2000
Sold by
Meyer Gary K and Meyer Colleen S
Bought by
Ward James and Selinger Barbara
Home Financials for this Owner
Home Financials are based on the most recent Mortgage that was taken out on this home.
Original Mortgage
$267,200
Interest Rate
8%
Create a Home Valuation Report for This Property
The Home Valuation Report is an in-depth analysis detailing your home's value as well as a comparison with similar homes in the area
Home Values in the Area
Average Home Value in this Area
Purchase History
| Date | Buyer | Sale Price | Title Company |
|---|---|---|---|
| Harris Charles | $475,000 | -- | |
| Ward James B | -- | -- | |
| Ward James | $334,000 | -- |
Source: Public Records
Mortgage History
| Date | Status | Borrower | Loan Amount |
|---|---|---|---|
| Open | Harris Charles | $225,000 | |
| Previous Owner | Ward James | $267,200 |
Source: Public Records
Tax History Compared to Growth
Tax History
| Year | Tax Paid | Tax Assessment Tax Assessment Total Assessment is a certain percentage of the fair market value that is determined by local assessors to be the total taxable value of land and additions on the property. | Land | Improvement |
|---|---|---|---|---|
| 2024 | $10,124 | $167,453 | $48,813 | $118,640 |
| 2023 | $9,726 | $151,432 | $44,143 | $107,289 |
| 2022 | $9,274 | $139,620 | $40,700 | $98,920 |
| 2021 | $9,032 | $131,321 | $38,281 | $93,040 |
| 2020 | $8,886 | $127,969 | $37,304 | $90,665 |
| 2019 | $8,698 | $122,823 | $35,804 | $87,019 |
| 2018 | $8,439 | $115,273 | $33,603 | $81,670 |
| 2017 | $8,654 | $115,108 | $37,334 | $77,774 |
| 2016 | $8,637 | $109,585 | $35,543 | $74,042 |
| 2015 | -- | $103,499 | $33,569 | $69,930 |
| 2014 | -- | $119,308 | $33,569 | $85,739 |
| 2013 | -- | $121,495 | $34,184 | $87,311 |
Source: Public Records
Map
Nearby Homes
- 40W455 Atchison Dr
- 40W414 Guthrie Ct
- Lot 019 Old Stage Rd
- 562 Lancaster Dr
- 410 Brookhaven Trail
- 395 Brookhaven Trail
- 1638 Francis Dr
- 1864 Hannah Ln
- 744 Lancaster Dr
- 695 Anchorage Ct
- 905 Shelter Island Ln
- 703 Anchorage Ct
- 975 Valley Stream Dr
- 870 Clover Ln
- 894 Clover Ln
- 906 Clover Ln Unit 906
- 893 Emerald Dr
- 937 Emerald Dr
- 1024 Birchwood Dr
- 929 Fairmont Rd
- 15N612 Red Leaf Rd
- 15N510 Atchison Dr
- 10 Atchison Dr
- 555 Prairie St
- 15N624 Red Leaf Rd
- 15N521 Atchison Dr
- 15N509 Prairie Hill Cir
- 15N460 Atchison Dr
- 15N625 Red Leaf Rd
- 40W734 Atchison Dr
- Lot 49 Prairie Hill Cir
- Lot 42 Prairie Hill Cir
- 15N483 Prairie Hill Cir
- 15N651 Red Leaf Rd
- 15N641 Red Leaf Rd Unit 3
- 40W786 Homestead Dr
- 15N630 Red Leaf Rd Unit 3
- 40W725 Atchison Dr
- 15N639 Red Leaf Rd
- 15N430 Atchison Dr