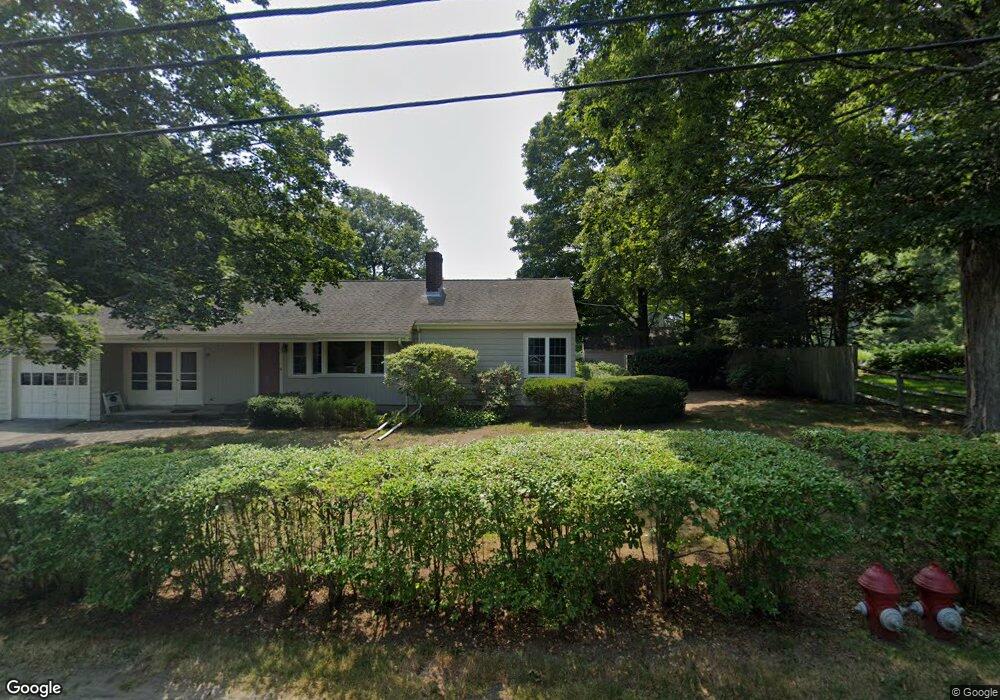
15R Cherry St Wenham, MA 01984
Estimated Value: $644,000 - $674,901
4
Beds
2
Baths
2,588
Sq Ft
$254/Sq Ft
Est. Value
About This Home
This home is located at 15R Cherry St, Wenham, MA 01984 and is currently estimated at $657,225, approximately $253 per square foot. 15R Cherry St is a home located in Essex County with nearby schools including Winthrop School, Cutler Elementary School, and Miles River Middle School.
Ownership History
Date
Name
Owned For
Owner Type
Purchase Details
Closed on
Oct 3, 2025
Sold by
Taylor Steven D
Bought by
Cecchi Jacopo and Graham Laurie
Current Estimated Value
Home Financials for this Owner
Home Financials are based on the most recent Mortgage that was taken out on this home.
Original Mortgage
$532,000
Outstanding Balance
$531,526
Interest Rate
6.58%
Mortgage Type
New Conventional
Estimated Equity
$125,699
Purchase Details
Closed on
Jan 17, 2024
Sold by
15 Cherry Street T and 15 Taylor
Bought by
Taylor Steven D
Purchase Details
Closed on
Jan 14, 2016
Sold by
Taylor Nt and Taylor
Bought by
15 Cherry Street T and 15 Taylor
Purchase Details
Closed on
Sep 28, 1998
Sold by
Riley-Belton Belton E and Riley-Belton Kathleen
Bought by
Taylor Nt and Taylo
Purchase Details
Closed on
Dec 17, 1993
Sold by
Margaret Bonaventura E and Margaret Bonaventura
Bought by
Belton E Travis E and Belton Kathleen
Home Financials for this Owner
Home Financials are based on the most recent Mortgage that was taken out on this home.
Original Mortgage
$135,200
Interest Rate
7.03%
Mortgage Type
Purchase Money Mortgage
Create a Home Valuation Report for This Property
The Home Valuation Report is an in-depth analysis detailing your home's value as well as a comparison with similar homes in the area
Home Values in the Area
Average Home Value in this Area
Purchase History
| Date | Buyer | Sale Price | Title Company |
|---|---|---|---|
| Cecchi Jacopo | $665,000 | -- | |
| Taylor Steven D | -- | None Available | |
| 15 Cherry Street T | -- | -- | |
| Taylor Nt | $241,000 | -- | |
| Belton E Travis E | $169,000 | -- |
Source: Public Records
Mortgage History
| Date | Status | Borrower | Loan Amount |
|---|---|---|---|
| Open | Cecchi Jacopo | $532,000 | |
| Previous Owner | Belton E Travis E | $387,250 | |
| Previous Owner | Belton E Travis E | $25,000 | |
| Previous Owner | Belton E Travis E | $135,200 |
Source: Public Records
Tax History Compared to Growth
Tax History
| Year | Tax Paid | Tax Assessment Tax Assessment Total Assessment is a certain percentage of the fair market value that is determined by local assessors to be the total taxable value of land and additions on the property. | Land | Improvement |
|---|---|---|---|---|
| 2025 | $11,360 | $731,000 | $475,300 | $255,700 |
| 2024 | $11,344 | $724,400 | $475,300 | $249,100 |
| 2023 | $11,706 | $674,700 | $433,400 | $241,300 |
| 2022 | $9,167 | $468,200 | $297,200 | $171,000 |
| 2021 | $8,779 | $446,100 | $275,100 | $171,000 |
| 2020 | $8,184 | $432,100 | $275,900 | $156,200 |
| 2019 | $7,786 | $432,100 | $275,900 | $156,200 |
| 2018 | $7,073 | $376,400 | $267,100 | $109,300 |
| 2017 | $6,899 | $376,400 | $267,100 | $109,300 |
| 2016 | $6,391 | $376,400 | $267,100 | $109,300 |
| 2015 | $5,722 | $352,100 | $242,800 | $109,300 |
Source: Public Records
Map
Nearby Homes