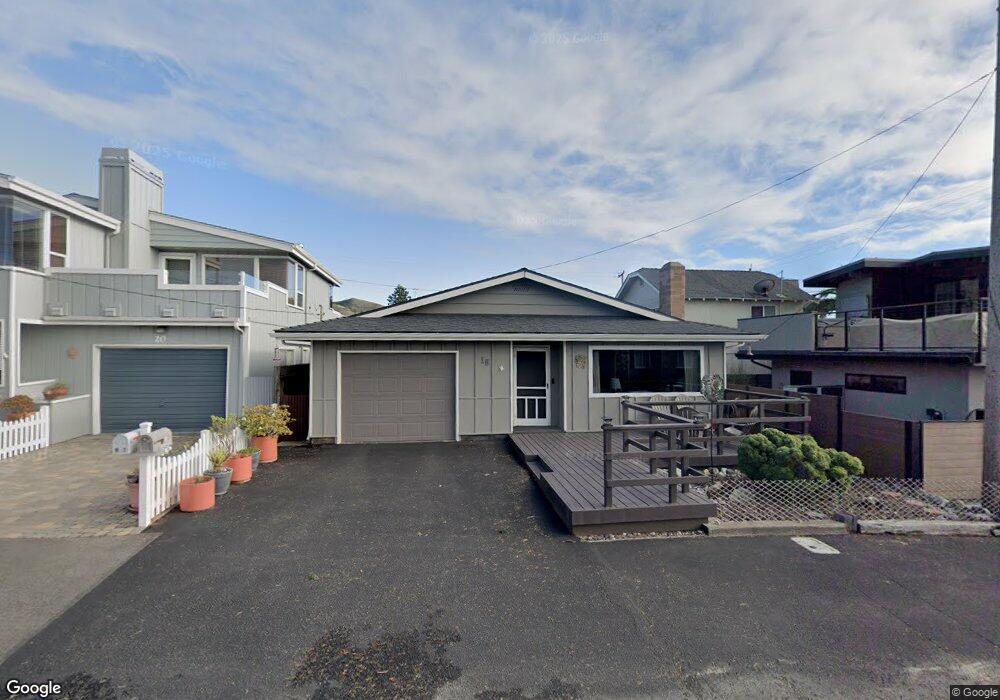
16 15th St Cayucos, CA 93430
Cayucos NeighborhoodEstimated Value: $1,071,054 - $1,481,000
3
Beds
2
Baths
1,370
Sq Ft
$974/Sq Ft
Est. Value
About This Home
This home is located at 16 15th St, Cayucos, CA 93430 and is currently estimated at $1,335,014, approximately $974 per square foot. 16 15th St is a home located in San Luis Obispo County.
Ownership History
Date
Name
Owned For
Owner Type
Purchase Details
Closed on
Jan 12, 2021
Sold by
Nicholson Pamela K
Bought by
Nicholson Steven and Nicholson Pamela K
Current Estimated Value
Purchase Details
Closed on
Aug 27, 2020
Sold by
Sage Norman R
Bought by
Sage Norman R and Sage Sara
Purchase Details
Closed on
Aug 26, 2020
Sold by
Sage Norman R
Bought by
Sage Norman R and Sage Sara
Purchase Details
Closed on
May 17, 2002
Sold by
Sage Morman R and Sage Sara J
Bought by
Sage Norman R and Sage Sara J
Create a Home Valuation Report for This Property
The Home Valuation Report is an in-depth analysis detailing your home's value as well as a comparison with similar homes in the area
Home Values in the Area
Average Home Value in this Area
Purchase History
| Date | Buyer | Sale Price | Title Company |
|---|---|---|---|
| Nicholson Steven | -- | None Available | |
| Sage Norman R | -- | -- | |
| Sage Norman R | -- | -- | |
| Sage Norman R | -- | -- |
Source: Public Records
Tax History
| Year | Tax Paid | Tax Assessment Tax Assessment Total Assessment is a certain percentage of the fair market value that is determined by local assessors to be the total taxable value of land and additions on the property. | Land | Improvement |
|---|---|---|---|---|
| 2025 | $1,248 | $108,347 | $28,161 | $80,186 |
| 2024 | $1,231 | $106,223 | $27,609 | $78,614 |
| 2023 | $1,231 | $104,141 | $27,068 | $77,073 |
| 2022 | $1,208 | $102,100 | $26,538 | $75,562 |
| 2021 | $1,185 | $100,099 | $26,018 | $74,081 |
| 2020 | $1,172 | $99,074 | $25,752 | $73,322 |
| 2019 | $1,149 | $97,133 | $25,248 | $71,885 |
| 2018 | $1,126 | $95,229 | $24,753 | $70,476 |
| 2017 | $1,102 | $93,363 | $24,268 | $69,095 |
| 2016 | $1,080 | $91,534 | $23,793 | $67,741 |
| 2015 | $1,070 | $90,160 | $23,436 | $66,724 |
| 2014 | $1,035 | $88,394 | $22,977 | $65,417 |
Source: Public Records
Map
Nearby Homes
- 57 17th St
- 1234 Pacific Ave
- 1625 Cass Ave Unit 22
- 2023 Circle Dr
- 96 24th St
- 0 California 1
- 1000 Saint Mary Ave
- 0 Studio Dr
- 50 5th St
- 510 Park Ave
- 50 S 3rd St
- 31 N 3rd St
- 2651 Richard Ave
- 191 J St
- 2712 Studio Dr
- 180 G St
- 2810 Santa Barbara Ave
- 2871 Studio Dr
- 0 Old Creek Rd Unit SC25189165
- 0 Ash Ave Unit SC25116716
Your Personal Tour Guide
Ask me questions while you tour the home.