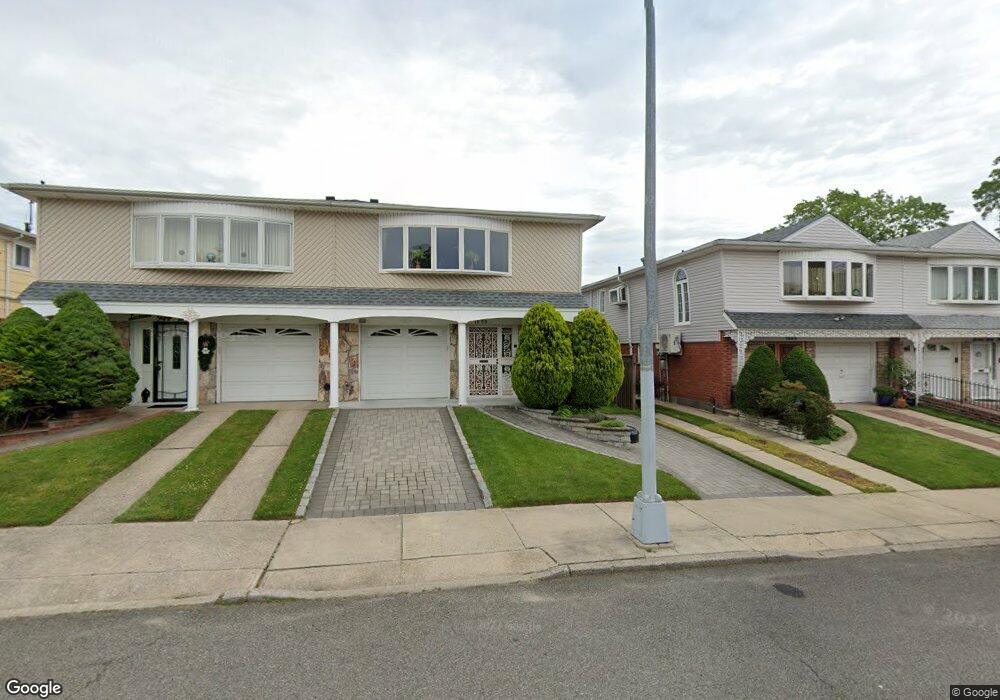
16-59 156th St Unit 1Fl Flushing, NY 11357
Whitestone NeighborhoodEstimated Value: $1,424,000 - $1,580,000
2
Beds
1
Bath
720
Sq Ft
$2,068/Sq Ft
Est. Value
About This Home
This home is located at 16-59 156th St Unit 1Fl, Flushing, NY 11357 and is currently estimated at $1,488,853, approximately $2,067 per square foot. 16-59 156th St Unit 1Fl is a home located in Queens County with nearby schools including P.S. 209 - Clearview Gardens, J.H.S. 194 William Carr, and Bayside High School.
Ownership History
Date
Name
Owned For
Owner Type
Purchase Details
Closed on
Oct 16, 2017
Sold by
Delos Santos Veronica
Bought by
Tong Kinying Helen
Current Estimated Value
Purchase Details
Closed on
Mar 16, 2011
Sold by
Tam Steven Y and Tong Kin Ying
Bought by
Tong Kin Ying
Purchase Details
Closed on
Dec 12, 2003
Sold by
Tam Kwong Lim and Tam Shung Che
Bought by
Tam Steven Y and Tong Kim Ying
Home Financials for this Owner
Home Financials are based on the most recent Mortgage that was taken out on this home.
Original Mortgage
$210,000
Interest Rate
5.65%
Mortgage Type
Purchase Money Mortgage
Purchase Details
Closed on
Mar 24, 1995
Sold by
Antolos Jerko and Antolos Rosanda
Bought by
Tam Steven Y and Tong Kin Ying
Home Financials for this Owner
Home Financials are based on the most recent Mortgage that was taken out on this home.
Original Mortgage
$248,000
Interest Rate
8.55%
Create a Home Valuation Report for This Property
The Home Valuation Report is an in-depth analysis detailing your home's value as well as a comparison with similar homes in the area
Home Values in the Area
Average Home Value in this Area
Purchase History
| Date | Buyer | Sale Price | Title Company |
|---|---|---|---|
| Tong Kinying Helen | $172,000 | -- | |
| Tong Kinying Helen | $172,000 | -- | |
| Tong Kin Ying | -- | -- | |
| Tong Kin Ying | -- | -- | |
| Tam Steven Y | -- | -- | |
| Tam Steven Y | -- | -- | |
| Tam Steven Y | $310,000 | First American Title Ins Co | |
| Tam Steven Y | $310,000 | First American Title Ins Co |
Source: Public Records
Mortgage History
| Date | Status | Borrower | Loan Amount |
|---|---|---|---|
| Previous Owner | Tam Steven Y | $210,000 | |
| Previous Owner | Tam Steven Y | $248,000 |
Source: Public Records
Tax History
| Year | Tax Paid | Tax Assessment Tax Assessment Total Assessment is a certain percentage of the fair market value that is determined by local assessors to be the total taxable value of land and additions on the property. | Land | Improvement |
|---|---|---|---|---|
| 2025 | $12,353 | $64,016 | $10,526 | $53,490 |
| 2024 | $12,365 | $62,903 | $9,713 | $53,190 |
| 2023 | $12,113 | $61,709 | $10,526 | $51,183 |
| 2022 | $11,678 | $70,680 | $13,980 | $56,700 |
| 2021 | $11,604 | $68,760 | $13,980 | $54,780 |
| 2020 | $10,996 | $69,780 | $13,980 | $55,800 |
| 2019 | $10,673 | $69,120 | $13,980 | $55,140 |
| 2018 | $10,185 | $51,424 | $12,006 | $39,418 |
| 2017 | $9,882 | $49,948 | $13,501 | $36,447 |
| 2016 | $9,110 | $49,948 | $13,501 | $36,447 |
| 2015 | $5,463 | $44,456 | $14,128 | $30,328 |
| 2014 | $5,463 | $43,683 | $13,631 | $30,052 |
Source: Public Records
Map
Nearby Homes
- 1665 156th St
- 158-22 16th Ave Unit 6-64
- 17-02 Clintonville St
- 15750 17th Ave Unit 540
- 157-45 17th Rd Unit 1
- 158-18 Cross Island Pkwy Unit 6-8
- 16-43 160th St
- 16-1 160th St Unit 6-279
- 16-41 160th St Unit 6-420
- 154-61 20th Ave
- 15-49 160th St Unit 6-145
- 160-08 16th Ave Unit 2nd Floor
- 15121 17th Ave
- 160-06 Cross Island Pkwy Unit 6-173
- 157-11 Cryders Ln
- 160-24 17th Ave Unit 1
- 1745 160th St Unit 5-65
- 154-27 20th Rd
- 151 E 20th St Unit 2-C
- 17 Murray St Unit 4
- 1659 156th St
- 16-65 156th St Unit 1
- 1657 156th St
- 1663 156th St
- 16-51 156th St
- 16-53 Locke Ave
- 16-53 156th St
- 1653 156th St
- 16-39 156th St Unit 1
- 154-11 17th Ave Unit 2
- 1651 156th St
- 1648 157th St
- 1644 157th St
- 1647 156th St
- 1650 157th St
- 1644 157th St
- 1640 157th St
- 1654 157th St
- 1640 157th St Unit 1
- 1640 157th St
Your Personal Tour Guide
Ask me questions while you tour the home.