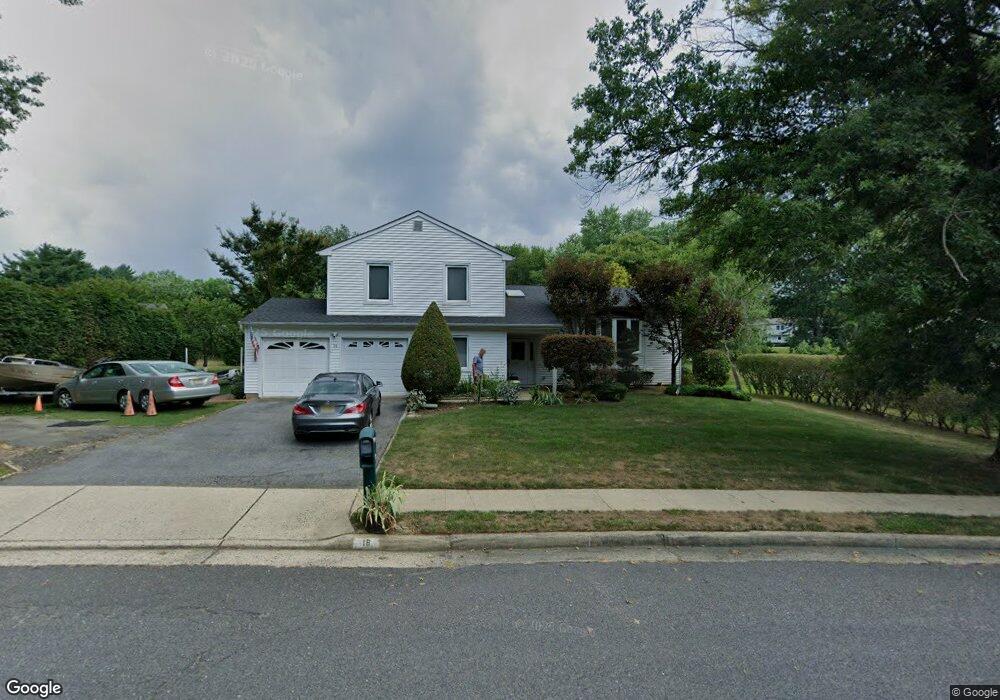
16 Algonquin Dr Marlboro, NJ 07746
Estimated Value: $772,134 - $868,000
3
Beds
3
Baths
2,114
Sq Ft
$395/Sq Ft
Est. Value
About This Home
This home is located at 16 Algonquin Dr, Marlboro, NJ 07746 and is currently estimated at $835,784, approximately $395 per square foot. 16 Algonquin Dr is a home located in Monmouth County with nearby schools including Asher Holmes Elementary School, Marlboro Middle School, and Marlboro High School.
Ownership History
Date
Name
Owned For
Owner Type
Purchase Details
Closed on
Jan 16, 2001
Sold by
Youdin Amy
Bought by
Rotondi Francesco and Rotondi Leonor
Current Estimated Value
Home Financials for this Owner
Home Financials are based on the most recent Mortgage that was taken out on this home.
Original Mortgage
$229,500
Outstanding Balance
$84,554
Interest Rate
7.52%
Estimated Equity
$751,230
Create a Home Valuation Report for This Property
The Home Valuation Report is an in-depth analysis detailing your home's value as well as a comparison with similar homes in the area
Home Values in the Area
Average Home Value in this Area
Purchase History
| Date | Buyer | Sale Price | Title Company |
|---|---|---|---|
| Rotondi Francesco | $270,000 | -- |
Source: Public Records
Mortgage History
| Date | Status | Borrower | Loan Amount |
|---|---|---|---|
| Open | Rotondi Francesco | $229,500 |
Source: Public Records
Tax History
| Year | Tax Paid | Tax Assessment Tax Assessment Total Assessment is a certain percentage of the fair market value that is determined by local assessors to be the total taxable value of land and additions on the property. | Land | Improvement |
|---|---|---|---|---|
| 2025 | $9,919 | $397,700 | $199,200 | $198,500 |
| 2024 | $9,481 | $397,700 | $199,200 | $198,500 |
Source: Public Records
Map
Nearby Homes
- 3 Alberta Dr
- 5 Washington Ave
- 1 Ciafardini Ct
- 141 Micki Dr
- 4 Canadian Woods Rd
- 4 Forest Ct
- 11 Liberty Rd
- 17 Emerald Dr
- 34 Brookside Cir
- 9 Fairview Rd
- 11 Woodview Dr
- 99 Caldwell Terrace
- 69 School Rd W
- 10 Syngle Way
- 211 Bradwick Way
- 54 Tracy Dr
- 407 Edinburgh Place
- 1801 Wrangler Ave
- 142 Scarborough Way
- 160 Scarborough Way
Your Personal Tour Guide
Ask me questions while you tour the home.