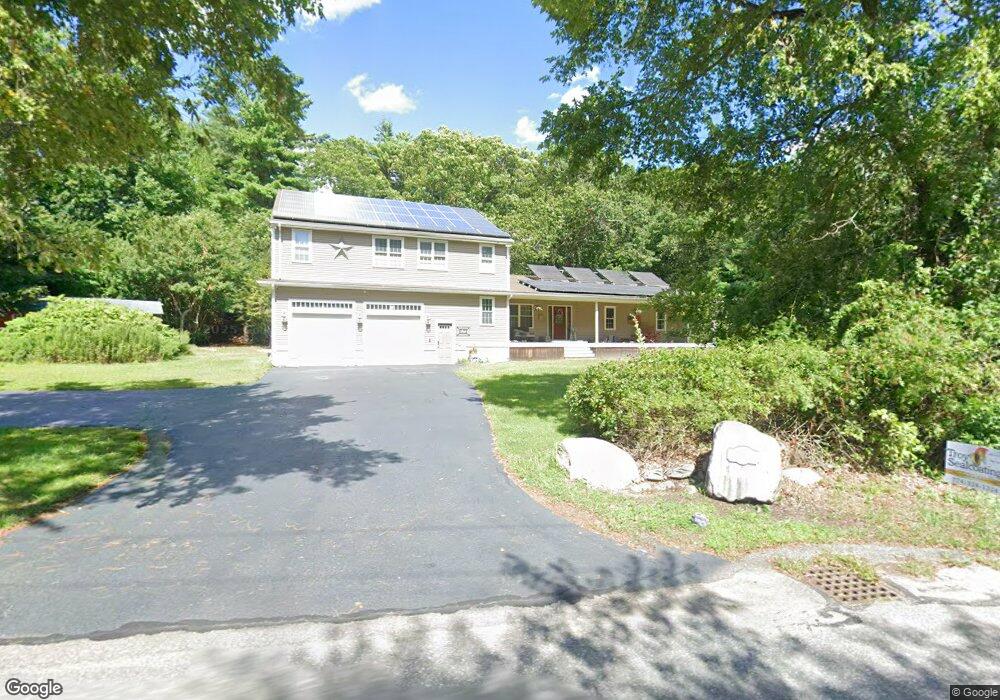
16 Anthony St Berkley, MA 02779
Myricks NeighborhoodEstimated Value: $522,000 - $814,000
2
Beds
1
Bath
816
Sq Ft
$809/Sq Ft
Est. Value
About This Home
This home is located at 16 Anthony St, Berkley, MA 02779 and is currently estimated at $660,537, approximately $809 per square foot. 16 Anthony St is a home located in Bristol County with nearby schools including Berkley Community School.
Ownership History
Date
Name
Owned For
Owner Type
Purchase Details
Closed on
Jul 15, 2003
Sold by
Parris John E
Bought by
Leite Jennifer R and Farland Richard A
Current Estimated Value
Purchase Details
Closed on
Apr 26, 2001
Sold by
Mccann Kevin and Bento Manuel
Bought by
Parris John E
Home Financials for this Owner
Home Financials are based on the most recent Mortgage that was taken out on this home.
Original Mortgage
$145,400
Interest Rate
6.88%
Mortgage Type
Purchase Money Mortgage
Purchase Details
Closed on
Oct 26, 1994
Sold by
Hersey Richard R and Hersey Kathy L
Bought by
Mccann Kevin and Bento Manuel
Home Financials for this Owner
Home Financials are based on the most recent Mortgage that was taken out on this home.
Original Mortgage
$89,900
Interest Rate
8.65%
Mortgage Type
Purchase Money Mortgage
Create a Home Valuation Report for This Property
The Home Valuation Report is an in-depth analysis detailing your home's value as well as a comparison with similar homes in the area
Home Values in the Area
Average Home Value in this Area
Purchase History
| Date | Buyer | Sale Price | Title Company |
|---|---|---|---|
| Leite Jennifer R | $225,000 | -- | |
| Parris John E | $149,900 | -- | |
| Mccann Kevin | $95,000 | -- |
Source: Public Records
Mortgage History
| Date | Status | Borrower | Loan Amount |
|---|---|---|---|
| Previous Owner | Mccann Kevin | $145,400 | |
| Previous Owner | Mccann Kevin | $89,900 | |
| Previous Owner | Mccann Kevin | $17,300 |
Source: Public Records
Tax History Compared to Growth
Tax History
| Year | Tax Paid | Tax Assessment Tax Assessment Total Assessment is a certain percentage of the fair market value that is determined by local assessors to be the total taxable value of land and additions on the property. | Land | Improvement |
|---|---|---|---|---|
| 2025 | $79 | $655,200 | $149,000 | $506,200 |
| 2024 | $7,587 | $609,400 | $128,300 | $481,100 |
| 2023 | $6,803 | $514,600 | $128,300 | $386,300 |
| 2022 | $6,662 | $484,500 | $111,600 | $372,900 |
| 2021 | $6,466 | $452,800 | $106,300 | $346,500 |
| 2020 | $6,437 | $443,000 | $93,900 | $349,100 |
| 2019 | $6,238 | $426,100 | $93,900 | $332,200 |
| 2018 | $5,715 | $407,600 | $90,300 | $317,300 |
| 2017 | $5,480 | $383,200 | $101,200 | $282,000 |
| 2016 | $5,246 | $353,500 | $101,200 | $252,300 |
| 2015 | $4,743 | $341,000 | $101,200 | $239,800 |
| 2014 | $4,521 | $352,900 | $109,800 | $243,100 |
Source: Public Records
Map
Nearby Homes