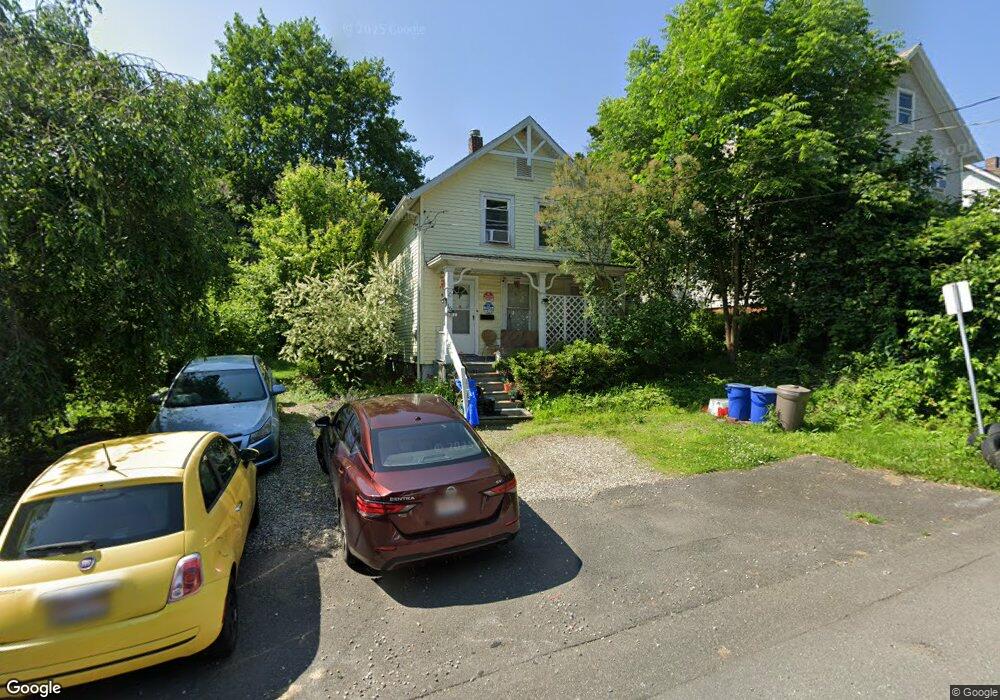
16 Arch St Greenfield, MA 01301
Estimated Value: $238,000 - $284,000
3
Beds
2
Baths
1,236
Sq Ft
$219/Sq Ft
Est. Value
About This Home
This home is located at 16 Arch St, Greenfield, MA 01301 and is currently estimated at $270,866, approximately $219 per square foot. 16 Arch St is a home located in Franklin County with nearby schools including Cornerstone Christian School and Holy Trinity School.
Ownership History
Date
Name
Owned For
Owner Type
Purchase Details
Closed on
May 30, 2001
Sold by
Department Of Housing & Urban Dev
Bought by
Rossman Deborah
Current Estimated Value
Home Financials for this Owner
Home Financials are based on the most recent Mortgage that was taken out on this home.
Original Mortgage
$76,105
Interest Rate
7.09%
Mortgage Type
Purchase Money Mortgage
Purchase Details
Closed on
Nov 3, 2000
Sold by
Woodard Cheryl M
Bought by
Fleet Mtg Corp
Purchase Details
Closed on
Jan 2, 1997
Sold by
Hatziperto Scott A
Bought by
Woodard Cheryl
Purchase Details
Closed on
May 20, 1988
Sold by
Lancour Ronald
Bought by
Hatzipetro Scott A
Purchase Details
Closed on
Nov 30, 1987
Sold by
Dunphy John J
Bought by
Lancour Ronald A
Create a Home Valuation Report for This Property
The Home Valuation Report is an in-depth analysis detailing your home's value as well as a comparison with similar homes in the area
Home Values in the Area
Average Home Value in this Area
Purchase History
| Date | Buyer | Sale Price | Title Company |
|---|---|---|---|
| Rossman Deborah | $45,000 | -- | |
| Rossman Deborah | $45,000 | -- | |
| Fleet Mtg Corp | $72,404 | -- | |
| Fleet Mtg Corp | $72,404 | -- | |
| Woodard Cheryl | $67,000 | -- | |
| Woodard Cheryl | $67,000 | -- | |
| Hatzipetro Scott A | $91,500 | -- | |
| Lancour Ronald A | $83,000 | -- |
Source: Public Records
Mortgage History
| Date | Status | Borrower | Loan Amount |
|---|---|---|---|
| Open | Lancour Ronald A | $77,246 | |
| Closed | Lancour Ronald A | $76,105 |
Source: Public Records
Tax History
| Year | Tax Paid | Tax Assessment Tax Assessment Total Assessment is a certain percentage of the fair market value that is determined by local assessors to be the total taxable value of land and additions on the property. | Land | Improvement |
|---|---|---|---|---|
| 2025 | $4,299 | $219,800 | $45,600 | $174,200 |
| 2024 | $4,376 | $214,600 | $41,700 | $172,900 |
| 2023 | $3,940 | $200,500 | $41,700 | $158,800 |
| 2022 | $3,832 | $171,700 | $39,700 | $132,000 |
| 2021 | $3,736 | $160,900 | $42,700 | $118,200 |
| 2020 | $3,492 | $152,300 | $38,700 | $113,600 |
| 2019 | $3,294 | $147,300 | $33,700 | $113,600 |
| 2018 | $3,239 | $144,400 | $33,100 | $111,300 |
| 2017 | $3,138 | $144,400 | $33,100 | $111,300 |
| 2016 | $2,966 | $136,000 | $28,800 | $107,200 |
| 2015 | $2,935 | $130,400 | $29,100 | $101,300 |
| 2014 | $2,677 | $130,400 | $29,100 | $101,300 |
Source: Public Records
Map
Nearby Homes
Your Personal Tour Guide
Ask me questions while you tour the home.