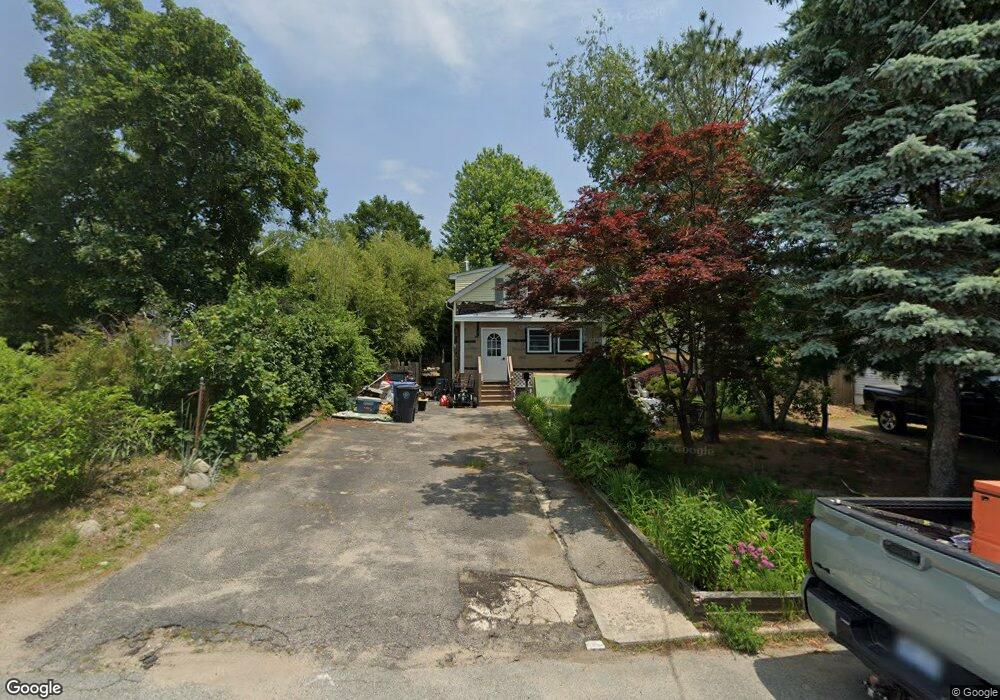
16 Ash Ave Cranston, RI 02910
Eden Park NeighborhoodEstimated Value: $301,000 - $437,000
3
Beds
1
Bath
864
Sq Ft
$413/Sq Ft
Est. Value
About This Home
This home is located at 16 Ash Ave, Cranston, RI 02910 and is currently estimated at $356,630, approximately $412 per square foot. 16 Ash Ave is a home located in Providence County with nearby schools including Park View Middle School, Cranston High School East, and Cadence Academy Preschool - Cranston.
Ownership History
Date
Name
Owned For
Owner Type
Purchase Details
Closed on
Oct 12, 2017
Sold by
Bourdon Craig and Bourdon Candace
Bought by
Lucke David M
Current Estimated Value
Home Financials for this Owner
Home Financials are based on the most recent Mortgage that was taken out on this home.
Original Mortgage
$144,993
Outstanding Balance
$122,299
Interest Rate
4.37%
Mortgage Type
FHA
Estimated Equity
$234,331
Purchase Details
Closed on
Oct 4, 2000
Sold by
Duke St Investment
Bought by
Boirdon Craig and Boirdon Candace
Purchase Details
Closed on
Apr 1, 1992
Sold by
Dibiasio David M
Bought by
Benoit Lois A
Create a Home Valuation Report for This Property
The Home Valuation Report is an in-depth analysis detailing your home's value as well as a comparison with similar homes in the area
Home Values in the Area
Average Home Value in this Area
Purchase History
| Date | Buyer | Sale Price | Title Company |
|---|---|---|---|
| Lucke David M | $150,000 | -- | |
| Boirdon Craig | $91,500 | -- | |
| Benoit Lois A | $79,000 | -- |
Source: Public Records
Mortgage History
| Date | Status | Borrower | Loan Amount |
|---|---|---|---|
| Open | Benoit Lois A | $144,993 | |
| Closed | Benoit Lois A | $7,500 | |
| Closed | Benoit Lois A | $5,500 |
Source: Public Records
Tax History
| Year | Tax Paid | Tax Assessment Tax Assessment Total Assessment is a certain percentage of the fair market value that is determined by local assessors to be the total taxable value of land and additions on the property. | Land | Improvement |
|---|---|---|---|---|
| 2025 | $3,723 | $268,200 | $107,500 | $160,700 |
| 2024 | $3,650 | $268,200 | $107,500 | $160,700 |
| 2023 | $3,474 | $183,800 | $70,700 | $113,100 |
| 2022 | $3,402 | $183,800 | $70,700 | $113,100 |
| 2021 | $3,308 | $183,800 | $70,700 | $113,100 |
| 2020 | $3,259 | $156,900 | $67,400 | $89,500 |
| 2019 | $3,259 | $156,900 | $67,400 | $89,500 |
| 2018 | $3,184 | $156,900 | $67,400 | $89,500 |
| 2017 | $3,101 | $135,200 | $60,600 | $74,600 |
| 2016 | $3,035 | $135,200 | $60,600 | $74,600 |
| 2015 | $3,035 | $135,200 | $60,600 | $74,600 |
| 2014 | $3,013 | $131,900 | $60,600 | $71,300 |
Source: Public Records
Map
Nearby Homes
- 10 Woburn St
- 10 Dale Ave
- 103 Harper Ave
- 167 Forest Ave
- 33 Hemlock Ave
- 64 Holburn Ave
- 150 Riverside Ave
- 54 Holburn Ave
- 144 Laurens St
- 25 Sharon St Unit 2
- 80 Colonial Ave
- 124 Clarence St
- 181 Grace St
- 129 1st Ave
- 75 Sharon St
- 859 Pontiac Ave
- 152 Woodbine St
- 123 Harrington Ave
- 0 Elmwood Ave
- 65 Perkins Ave
Your Personal Tour Guide
Ask me questions while you tour the home.