Estimated Value: $334,000 - $343,000
2
Beds
2
Baths
1,308
Sq Ft
$259/Sq Ft
Est. Value
About This Home
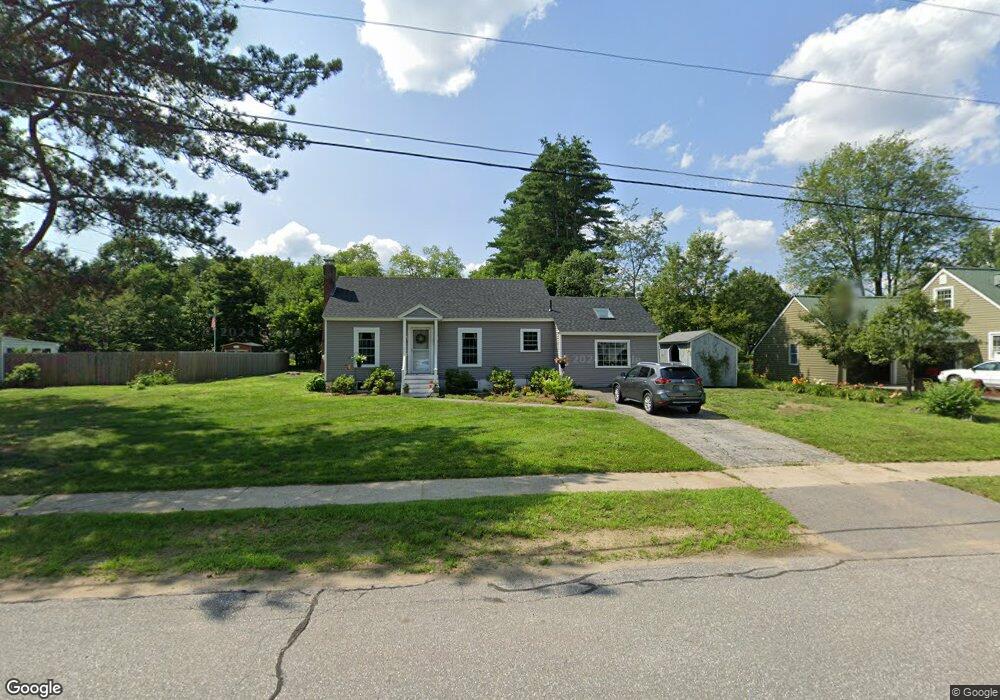
This home is located at 16 Aspen St, Keene, NH 03431 and is currently estimated at $338,890, approximately $259 per square foot. 16 Aspen St is a home with nearby schools including Mount Gilead Elementary School, Fuller Elementary School, and Keene Middle School.
Ownership History
Date
Name
Owned For
Owner Type
Purchase Details
Closed on
Jun 27, 2003
Sold by
Christopher Robert C and Christopher Gwyn E
Bought by
Junge Denise M
Current Estimated Value
Home Financials for this Owner
Home Financials are based on the most recent Mortgage that was taken out on this home.
Original Mortgage
$111,920
Outstanding Balance
$48,550
Interest Rate
5.53%
Estimated Equity
$290,340
Purchase Details
Closed on
Jul 19, 1996
Sold by
Butler Geoffrey and Butler Abigail
Bought by
Christopher Robert C and Christopher Gwyn E
Home Financials for this Owner
Home Financials are based on the most recent Mortgage that was taken out on this home.
Original Mortgage
$78,732
Interest Rate
8.28%
Create a Home Valuation Report for This Property
The Home Valuation Report is an in-depth analysis detailing your home's value as well as a comparison with similar homes in the area
Home Values in the Area
Average Home Value in this Area
Purchase History
| Date | Buyer | Sale Price | Title Company |
|---|---|---|---|
| Junge Denise M | $139,900 | -- | |
| Christopher Robert C | $79,000 | -- |
Source: Public Records
Mortgage History
| Date | Status | Borrower | Loan Amount |
|---|---|---|---|
| Open | Christopher Robert C | $111,920 | |
| Previous Owner | Christopher Robert C | $78,732 |
Source: Public Records
Tax History Compared to Growth
Tax History
| Year | Tax Paid | Tax Assessment Tax Assessment Total Assessment is a certain percentage of the fair market value that is determined by local assessors to be the total taxable value of land and additions on the property. | Land | Improvement |
|---|---|---|---|---|
| 2024 | $6,095 | $184,300 | $47,500 | $136,800 |
| 2023 | $5,877 | $184,300 | $47,500 | $136,800 |
| 2022 | $5,719 | $184,300 | $47,500 | $136,800 |
| 2021 | $5,765 | $184,300 | $47,500 | $136,800 |
| 2020 | $5,760 | $154,500 | $55,600 | $98,900 |
| 2019 | $5,809 | $154,500 | $55,600 | $98,900 |
| 2018 | $5,735 | $154,500 | $55,600 | $98,900 |
| 2017 | $5,750 | $154,500 | $55,600 | $98,900 |
| 2016 | $5,622 | $154,500 | $55,600 | $98,900 |
| 2015 | $6,294 | $182,900 | $68,200 | $114,700 |
Source: Public Records
Map
Nearby Homes
- 257 Park Ave
- 7 Newman St
- 45 Blossom St
- 18 Stanton Ct
- 110 Arch St Unit 27
- 110 Arch St Unit 42
- 67 Woodburn St
- 17 Blue Jay Ct
- 11 Nut Hatch Ln
- 0 Stevens St Unit 1
- 23 Base Hill Rd
- 28 Stonehouse Ln
- 220 Hurricane Rd
- 38 Stonehouse Ln Unit A
- 50 Forest St
- 106 Pako Ave
- 39 Windsor Ct Unit B
- 792 Court St Unit A
- 798 Court St Unit G
- 316 Perk St