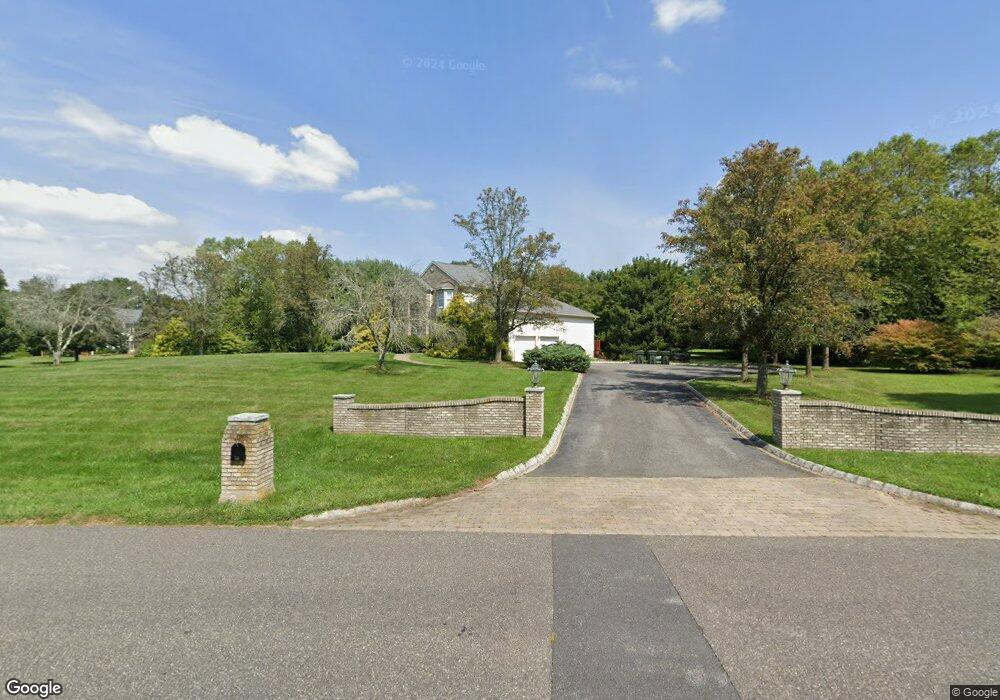
16 Babbitt Way Allentown, NJ 08501
Estimated Value: $834,000 - $1,105,000
4
Beds
3
Baths
3,102
Sq Ft
$325/Sq Ft
Est. Value
About This Home
This home is located at 16 Babbitt Way, Allentown, NJ 08501 and is currently estimated at $1,009,468, approximately $325 per square foot. 16 Babbitt Way is a home located in Monmouth County with nearby schools including Newell Elementary School, Stonebridge Middle School, and Allentown High School.
Ownership History
Date
Name
Owned For
Owner Type
Purchase Details
Closed on
Mar 25, 2014
Sold by
Taft Ronald S
Bought by
Mendelsohn Cynthia
Current Estimated Value
Home Financials for this Owner
Home Financials are based on the most recent Mortgage that was taken out on this home.
Original Mortgage
$218,450
Interest Rate
4.25%
Mortgage Type
Purchase Money Mortgage
Purchase Details
Closed on
Oct 21, 2009
Sold by
Stanaway Scott J and Stanaway Cynthia M
Bought by
Stanaway Cynthia M
Create a Home Valuation Report for This Property
The Home Valuation Report is an in-depth analysis detailing your home's value as well as a comparison with similar homes in the area
Home Values in the Area
Average Home Value in this Area
Purchase History
| Date | Buyer | Sale Price | Title Company |
|---|---|---|---|
| Mendelsohn Cynthia | $332,250 | Chicago Title Insurance Co | |
| Stanaway Cynthia M | -- | Chicago Title Insurance Co |
Source: Public Records
Mortgage History
| Date | Status | Borrower | Loan Amount |
|---|---|---|---|
| Closed | Mendelsohn Cynthia | $218,450 |
Source: Public Records
Tax History Compared to Growth
Tax History
| Year | Tax Paid | Tax Assessment Tax Assessment Total Assessment is a certain percentage of the fair market value that is determined by local assessors to be the total taxable value of land and additions on the property. | Land | Improvement |
|---|---|---|---|---|
| 2025 | $16,110 | $910,800 | $267,000 | $643,800 |
| 2024 | $16,007 | $747,200 | $167,000 | $580,200 |
| 2023 | $16,007 | $720,700 | $167,000 | $553,700 |
| 2022 | $13,928 | $609,600 | $167,000 | $442,600 |
| 2021 | $13,928 | $592,700 | $167,000 | $425,700 |
| 2020 | $14,018 | $580,700 | $167,000 | $413,700 |
| 2019 | $13,354 | $557,100 | $172,000 | $385,100 |
| 2018 | $13,554 | $557,100 | $190,000 | $367,100 |
| 2017 | $13,462 | $560,700 | $202,600 | $358,100 |
| 2016 | $13,086 | $551,700 | $202,600 | $349,100 |
| 2015 | $12,847 | $547,400 | $210,000 | $337,400 |
| 2014 | $12,353 | $530,400 | $170,000 | $360,400 |
Source: Public Records
Map
Nearby Homes
- 20 Yeger Dr
- 703 Route 524
- 110 Imlaystown Hightstown Rd
- 3 Allyson Way
- 38 Herbert Rd
- 163 Sharon Station Rd
- 47 Imlaystown Rd
- 0 Route 524
- 467 Gordon Rd
- 33 Allens Rd
- 10 Saddlebrook Rd
- 824 Windsor Perrineville Rd
- 11 Probasco Dr
- 10 Rolling Meadows Ct
- 33 Lake Dr
- 865 Windsor Perrineville Rd
- 17 Grant Dr
- 8 Coates Rd
- 34 N Main St
- 21 Homestead Ln