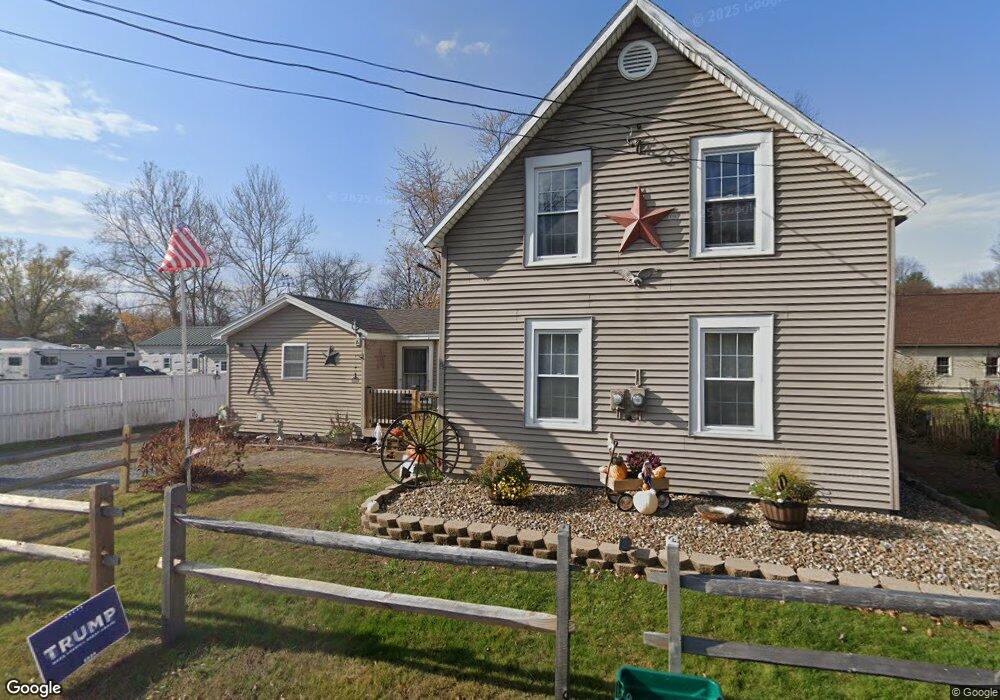
16 Baldwin Ct Charlestown, NH 03603
Estimated Value: $238,559 - $289,000
4
Beds
3
Baths
1,554
Sq Ft
$164/Sq Ft
Est. Value
About This Home
This home is located at 16 Baldwin Ct, Charlestown, NH 03603 and is currently estimated at $254,640, approximately $163 per square foot. 16 Baldwin Ct is a home located in Sullivan County with nearby schools including Charlestown Primary School, Charlestown Middle School, and Fall Mountain Regional High School.
Ownership History
Date
Name
Owned For
Owner Type
Purchase Details
Closed on
Jul 16, 2021
Sold by
Lamontagne James J and Lamontagne Serena M
Bought by
Lamontagne James J and Lamontagne Serena M
Current Estimated Value
Home Financials for this Owner
Home Financials are based on the most recent Mortgage that was taken out on this home.
Original Mortgage
$125,000
Outstanding Balance
$94,304
Interest Rate
2.2%
Mortgage Type
Stand Alone Refi Refinance Of Original Loan
Estimated Equity
$160,336
Create a Home Valuation Report for This Property
The Home Valuation Report is an in-depth analysis detailing your home's value as well as a comparison with similar homes in the area
Home Values in the Area
Average Home Value in this Area
Purchase History
| Date | Buyer | Sale Price | Title Company |
|---|---|---|---|
| Lamontagne James J | -- | None Available | |
| Lamontagne James J | -- | None Available |
Source: Public Records
Mortgage History
| Date | Status | Borrower | Loan Amount |
|---|---|---|---|
| Open | Lamontagne James J | $125,000 |
Source: Public Records
Tax History Compared to Growth
Tax History
| Year | Tax Paid | Tax Assessment Tax Assessment Total Assessment is a certain percentage of the fair market value that is determined by local assessors to be the total taxable value of land and additions on the property. | Land | Improvement |
|---|---|---|---|---|
| 2024 | $4,556 | $125,300 | $24,800 | $100,500 |
| 2023 | $4,299 | $125,300 | $24,800 | $100,500 |
| 2022 | $4,043 | $125,300 | $24,800 | $100,500 |
| 2021 | $3,961 | $125,300 | $24,800 | $100,500 |
| 2020 | $8,683 | $123,400 | $27,400 | $96,000 |
| 2019 | $4,826 | $123,400 | $27,400 | $96,000 |
| 2017 | $4,504 | $123,400 | $27,400 | $96,000 |
| 2016 | $4,325 | $123,400 | $27,400 | $96,000 |
| 2015 | $3,995 | $124,100 | $22,200 | $101,900 |
| 2014 | $3,908 | $124,100 | $22,200 | $101,900 |
| 2013 | $4,006 | $124,100 | $22,200 | $101,900 |
Source: Public Records
Map
Nearby Homes
- 29 River St
- 71 River St
- 38 Railroad St
- 57 Hammond Acres
- 69 Stevens Rd
- 2 Lower Landing Park
- 63 Riverview Dr
- 11 Bracket Cir
- 476 Missing Link Rd
- 10 Riverfront Dr
- 20 Ponderosa Park
- 2 Crown Point Dr Unit A
- 0 Norman Ave Unit 6
- 0 Claremont Rd Unit 6
- 123 Hepatica Ln
- 52 Morways Park
- 41 Morways Park
- 25 Morways Park
- 0 Missing Link Rd
- 76 Hillside Dr
- 45 Bridge St
- 21 Baldwin Ct
- 63 Bridge St
- 24 Baldwin Ct
- 27 Baldwin Ct
- 23 Bridge St
- 122 Northwest St
- 42 Bridge St
- 60 Bridge St
- 39 Baldwin Ct
- 112 Northwest St
- 52 Bridge St
- 44 Baldwin Ct
- 135 Northwest St
- 34 Bridge St
- 108 Northwest St
- 149 Northwest St
- 170 Northwest St
- 7 Old Springfield Rd
- 115 Northwest St