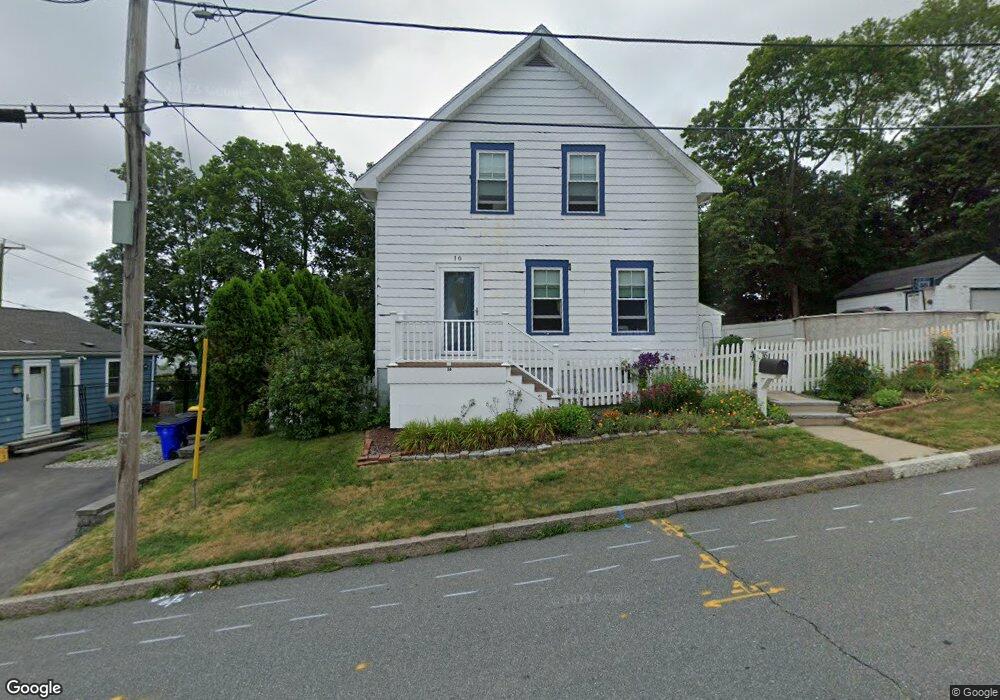
16 Baldwin St Fall River, MA 02720
Western Fall River NeighborhoodEstimated Value: $388,000 - $491,000
3
Beds
2
Baths
1,374
Sq Ft
$307/Sq Ft
Est. Value
About This Home
This home is located at 16 Baldwin St, Fall River, MA 02720 and is currently estimated at $421,847, approximately $307 per square foot. 16 Baldwin St is a home located in Bristol County with nearby schools including North End Elementary School, Morton Middle School, and B M C Durfee High School.
Ownership History
Date
Name
Owned For
Owner Type
Purchase Details
Closed on
Dec 1, 1998
Sold by
Clark Michael W
Bought by
Dias Jennifer
Current Estimated Value
Purchase Details
Closed on
Jul 7, 1992
Sold by
Clark Charles W
Bought by
Clark Michael W
Create a Home Valuation Report for This Property
The Home Valuation Report is an in-depth analysis detailing your home's value as well as a comparison with similar homes in the area
Home Values in the Area
Average Home Value in this Area
Purchase History
| Date | Buyer | Sale Price | Title Company |
|---|---|---|---|
| Dias Jennifer | $95,000 | -- | |
| Clark Michael W | $90,000 | -- |
Source: Public Records
Mortgage History
| Date | Status | Borrower | Loan Amount |
|---|---|---|---|
| Open | Clark Michael W | $140,000 | |
| Closed | Clark Michael W | $17,724 | |
| Closed | Clark Michael W | $105,000 |
Source: Public Records
Tax History
| Year | Tax Paid | Tax Assessment Tax Assessment Total Assessment is a certain percentage of the fair market value that is determined by local assessors to be the total taxable value of land and additions on the property. | Land | Improvement |
|---|---|---|---|---|
| 2025 | $3,458 | $302,000 | $118,500 | $183,500 |
| 2024 | $3,290 | $286,300 | $116,200 | $170,100 |
| 2023 | $3,112 | $253,600 | $104,700 | $148,900 |
| 2022 | $2,708 | $231,400 | $98,800 | $132,600 |
| 2021 | $2,708 | $195,800 | $94,400 | $101,400 |
| 2020 | $2,705 | $187,200 | $90,100 | $97,100 |
| 2019 | $2,710 | $185,900 | $94,100 | $91,800 |
| 2018 | $2,651 | $181,300 | $94,800 | $86,500 |
| 2017 | $2,528 | $180,600 | $94,800 | $85,800 |
| 2016 | $2,444 | $179,300 | $97,700 | $81,600 |
| 2015 | $2,345 | $179,300 | $97,700 | $81,600 |
| 2014 | $2,256 | $179,300 | $97,700 | $81,600 |
Source: Public Records
Map
Nearby Homes
- 33 Warner St
- 257 Calvin St
- 1810 Highland Ave Unit 22
- Parcel 2 Highcrest Rd
- 3636 N Main St Unit 5
- 29 Valentine St
- 210 Harrison Ave
- 274 Archer St
- 2714 Riverside Ave
- 195 Crescent St Unit 3
- 54 Grant Ave
- 1553 Riverside Ave
- 2106 Meridian St
- 108 Stowe St Unit 108
- 1496 Riverside Ave
- 247 Albany St
- 230 College Park Rd
- 201 Montgomery Cir
- 333 Langley St
- 34 Doherty Ave
Your Personal Tour Guide
Ask me questions while you tour the home.